Whidbey Island Real Estate Market Update: May 2026
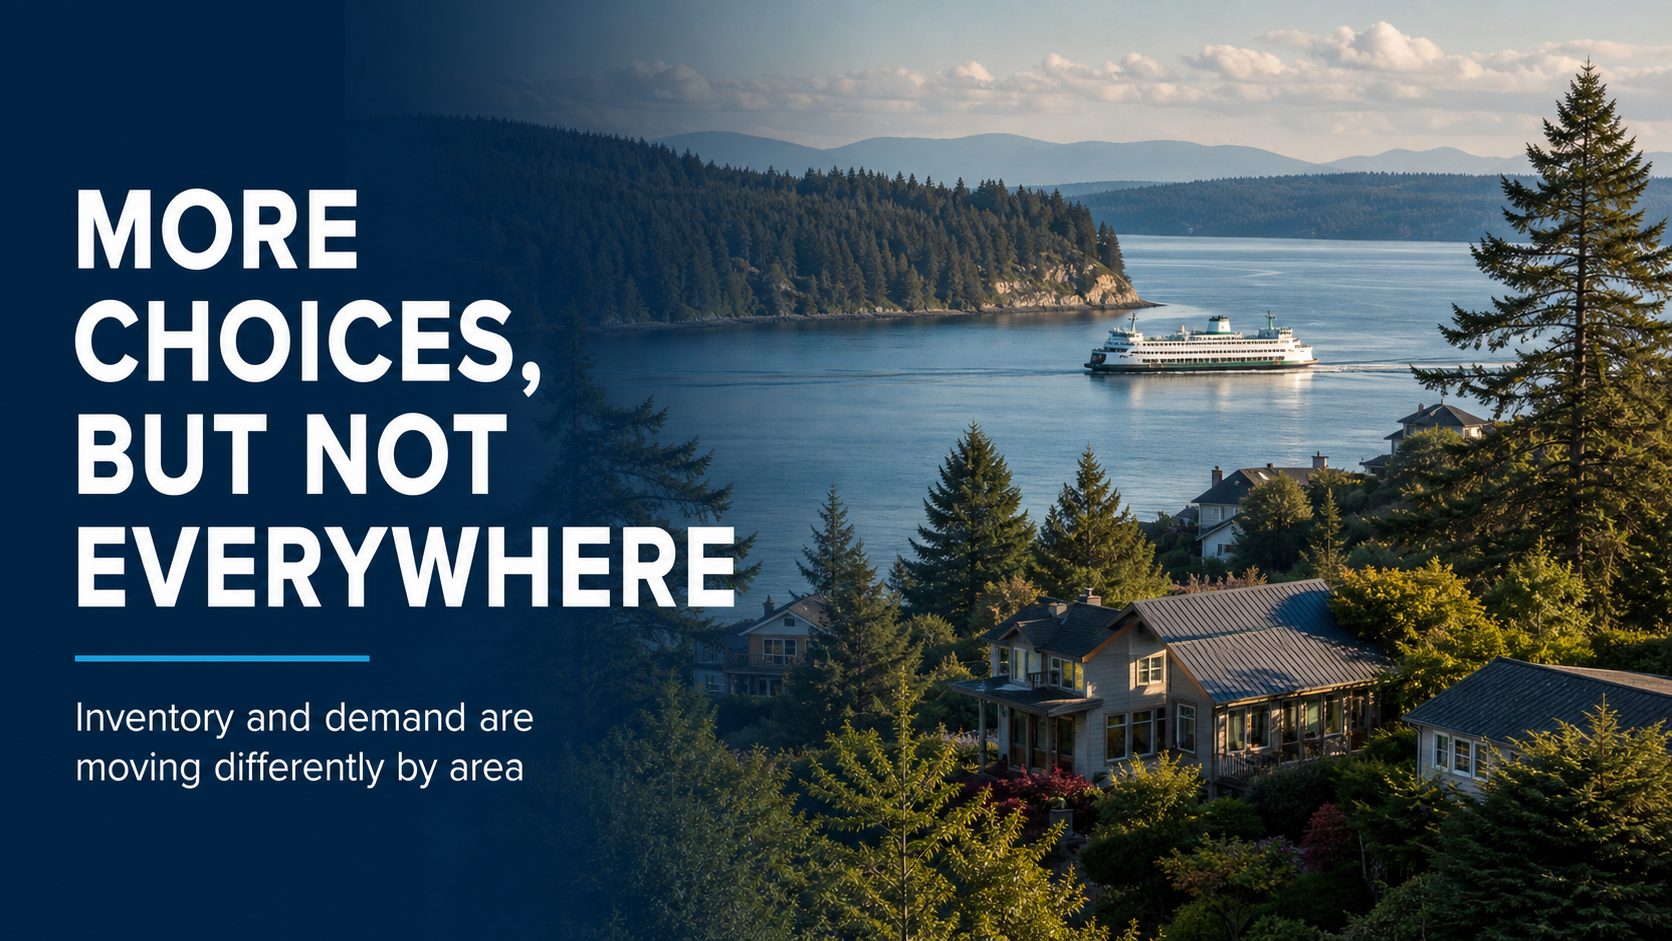
Whidbey's market shifted in May, but not in the tidy, spreadsheet-friendly way that makes everyone nod and move on. Some buyers got more choices. Some sellers still had leverage. Some price bands perked up. Others hit the snooze button and asked for five more minutes.
The useful story is local and uneven: South Whidbey, Central Whidbey, and North Whidbey are not wearing the same outfit to this market. If you are buying or selling, the islandwide average is a starting point, not a strategy.
The short version: Central Whidbey gained the clearest inventory breathing room, South Whidbey stayed more balanced than dramatic, and North Whidbey remained active but more selective than last year.
May 2026 Snapshot: Pick a Metric
Animated local comparison by Whidbey submarket. Hover for exact values.
20262025
Inventory
Inventory is opening unevenly
South Whidbey ended May with 120 active residential and condo listings, slightly below 124 at the same point last year. That is not a flood of inventory. It is more like someone cracked a window and let a little air in.
Central Whidbey is where the inventory story gets louder. Active listings rose 43.6% year over year, from 39 to 56. New listings were up too, and pendings rose alongside them. Translation: buyers saw more options, but they were not alone in noticing.
North Whidbey had the same active listing count as last year, 116, but May new listings, pendings, and closed sales were all lower than May 2025. It is still the highest-volume part of the island, but buyers appear more choosy. The market has not stopped. It has started reading the fine print.
Pricing
The average is useful. It is also a little sneaky.
Median active price moved in different directions by area. South Whidbey's median active price was $889,000, down 1.0% from last May. Central Whidbey's was $730,000, down 7.0%. North Whidbey moved higher, up 11.5% to $622,475.
Median Sale Price Trend
Hover points for annual median sale prices, 2013 through 2026 YTD.
South WhidbeyCentral WhidbeyNorth Whidbey
This is where the islandwide average starts acting like it knows more than it does. A waterfront Greenbank property, a Holmes Harbor home with flexible living space, a Mutiny Bay retreat, and a North Whidbey neighborhood home are all technically "Whidbey real estate." They are not the same market in practice.
That matters for pricing. It matters for offers. It matters for how long a listing should sit before a price adjustment becomes a conversation instead of a confession.
Price Bands
The market gets clearer when you stop averaging everything together
South Whidbey had 102 year-to-date sales compared with 97 a year earlier, while new listings rose from 215 to 241. Central Whidbey had 61 year-to-date sales compared with 56 last year, with new listings up sharply. North Whidbey had fewer year-to-date sales and fewer new listings than last year, which tells a different story from Central entirely.
Price Points: Sales vs. New Listings
Choose a view and submarket. Hover bars for exact values.
20262025
The price-band charts show why "the market is up" or "the market is slow" is too blunt to be helpful. South Whidbey had more activity in some upper brackets and fewer sales in others. Central Whidbey added supply across several ranges. North Whidbey softened in lower brackets while still showing life around the middle of the market.
That is not a contradiction. That is Whidbey. Around here, the details do not ride in the back seat; they drive.
What buyers should do with this
Buyers should be encouraged, but not cocky. There are more options in some pockets, and selective sellers may be more willing to talk. But the best-positioned homes can still move quickly, especially when condition, location, and price all show up wearing the same jersey.
Watch the boring things. Days on market. Price changes. Competing inventory. Condition. Inspection risk. Whether the view is truly a view or just a charming peek if you stand on one foot in February.
What sellers should do with this
Sellers should not panic, but they should respect the market. Pricing too high and waiting for the perfect buyer can work when inventory is starved. In a more selective market, that strategy starts to look like leaving the ferry line to "find a shortcut."
A strong seller plan should start with a micro-market review: nearby sales, active competition, price-band movement, condition, view or waterfront premiums, and how buyers are behaving right now for your specific property type.
Averages are only a starting point. Price segments, property types, condition, location, waterfront or view attributes, acreage, neighborhood, and micro-markets can move differently. Before making a pricing, offer, or timing decision, talk with a local Whidbey expert about your specific property or search.
FAQ
Is Whidbey Island a buyer's market or seller's market right now?
It depends on the area and price point. The June Facts & Trends reports described South Whidbey as neutral in May 2026, Central Whidbey as a buyer's market, and North Whidbey as a seller's market. That is why a submarket-specific read matters.
Are Whidbey Island home prices going up or down?
Prices are mixed by area and by property type. South Whidbey and Central Whidbey had lower median active prices than last May, while North Whidbey's median active price was higher. Median sale price trends also vary by submarket.
Why do Whidbey real estate numbers vary so much by area?
Whidbey Island has very different housing segments, including waterfront homes, view properties, wooded acreage, in-town homes, condos, and neighborhood homes. Buyer pools and inventory levels can be very different from South Whidbey to Central Whidbey to North Whidbey.
Should I use islandwide averages to price my Whidbey home?
No. Islandwide averages can provide context, but pricing should be based on your specific property, condition, location, view or waterfront attributes, recent comparable sales, current competition, and the price segment you are in.
Data supplied by the NWMLS and local Windermere Whidbey market report materials. Neither the board nor its MLS guarantees its accuracy, and the data may not reflect all real estate activity in the market. Listing facts were checked against the linked listing pages on June 10, 2026.
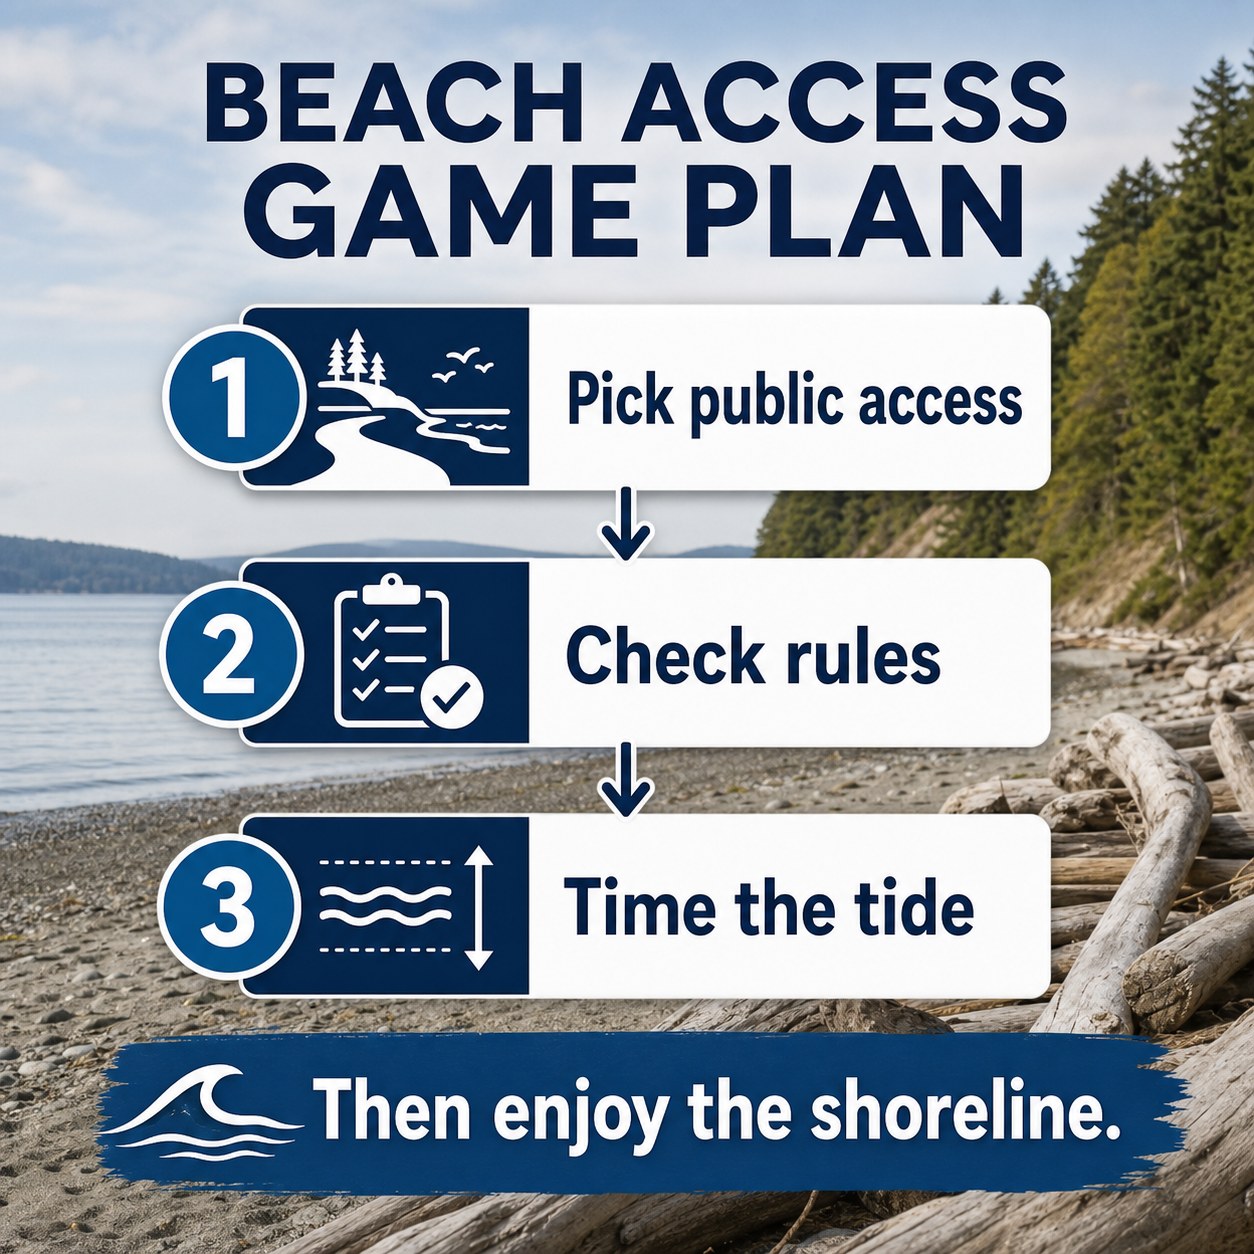
A good Whidbey beach day starts before you step onto the sand. The right public access point depends on what you want to do: walk the dog, picnic with kids, follow a bluff trail, beachcomb at low tide, watch the sunset, or simply find a quiet stretch of shoreline where the rules are clear.
Whidbey Island has public beaches, county parks, state parks, road-end access points, private shoreline, tidelands, shellfish rules, leash boundaries, parking limits, and tide conditions that can change the whole feel of a visit. This guide is meant to help you choose wisely, check the right sources, and enjoy the shoreline respectfully.
Quick Takeaways
Double Bluff is the best-known South Whidbey beach for long sandy walks and off-leash dog access, but dogs must be leashed from the parking lot until the marked off-leash boundary.
Fort Casey, Fort Ebey, and Joseph Whidbey are state parks, so plan around Discover Pass requirements and current park rules.
Ebey’s Landing is a bluff-and-beach outing, not a casual flat beach stroll for every visitor.
Shellfish harvesting is never a guess. Check current DOH, Island County, and WDFW information before harvesting.
Not every shoreline is public. Public access points and private beach areas can sit close together on Whidbey.
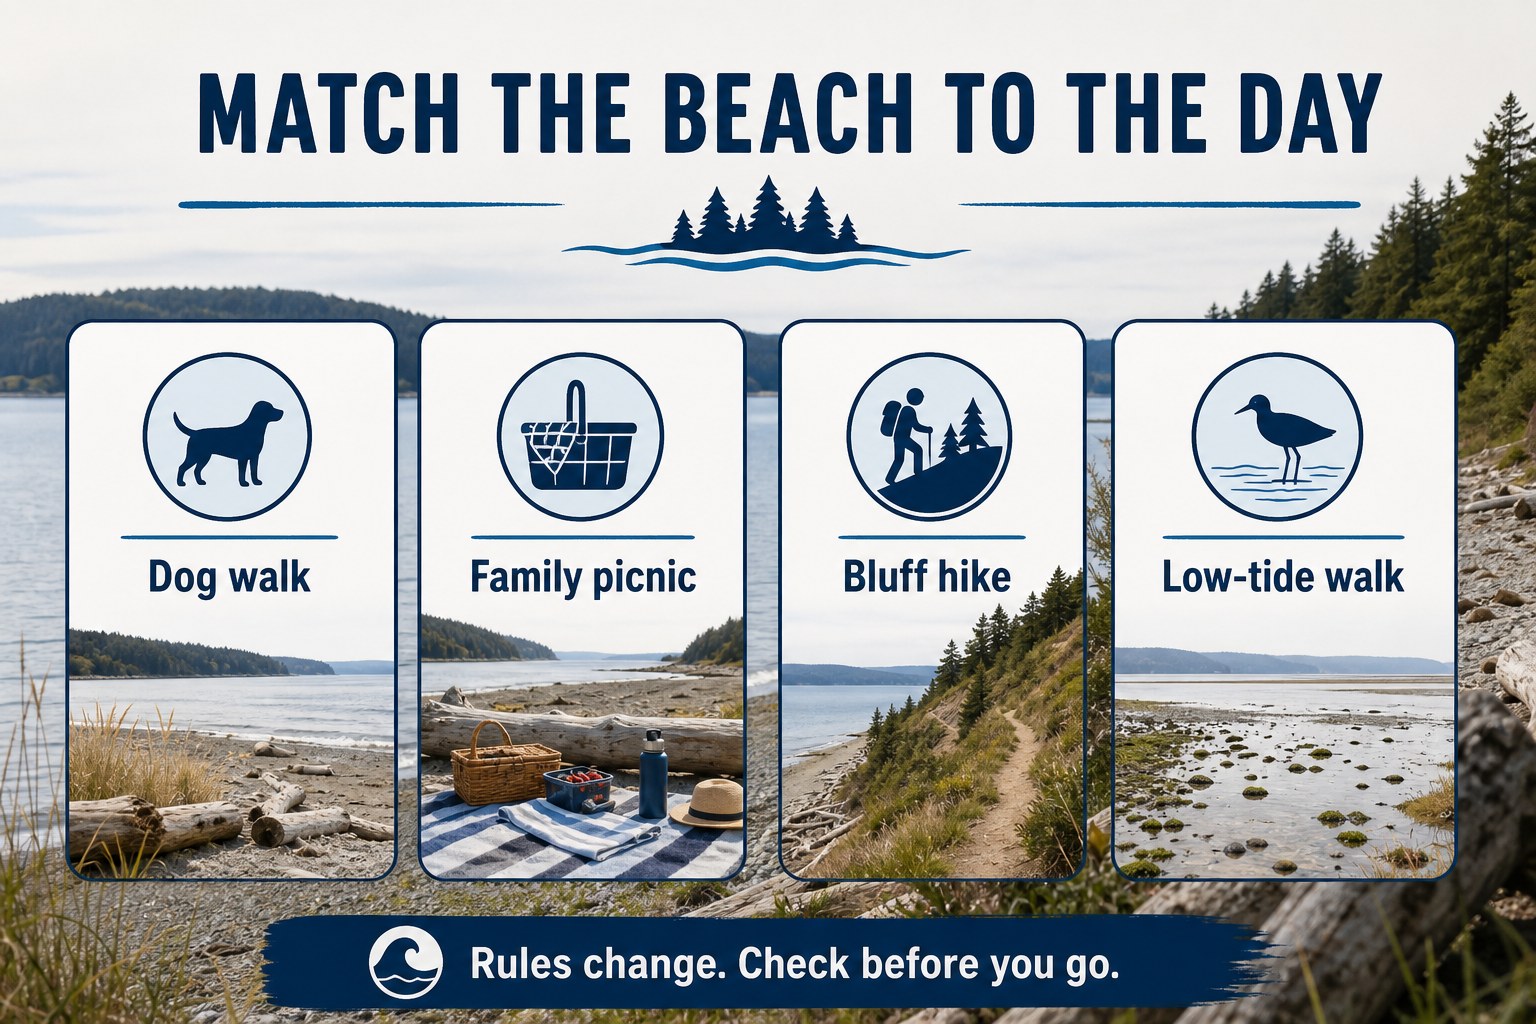
Instead of asking for the single best beach on Whidbey, start with the day you want. A beach that is perfect for a low-tide walk may be less convenient for a picnic. A dramatic bluff trail may not be the right fit for a stroller. A dog-friendly beach may have specific boundaries that matter as soon as you leave the parking lot.
Dog Walk
Start with Double Bluff, then verify the current leash boundary and county rules before assuming your dog can be off leash.
Family Picnic
Look for restrooms, picnic tables, playgrounds, and simpler parking. Freeland Park and Maxwelton Park are practical South Whidbey examples.
Bluff Hike
Ebey’s Landing and Fort Ebey are better for walkers who want views, trail time, and a more active outing.
Low-Tide Walk
Check the tide first. Some Whidbey beaches open up dramatically at low tide and feel much tighter when the water is high.
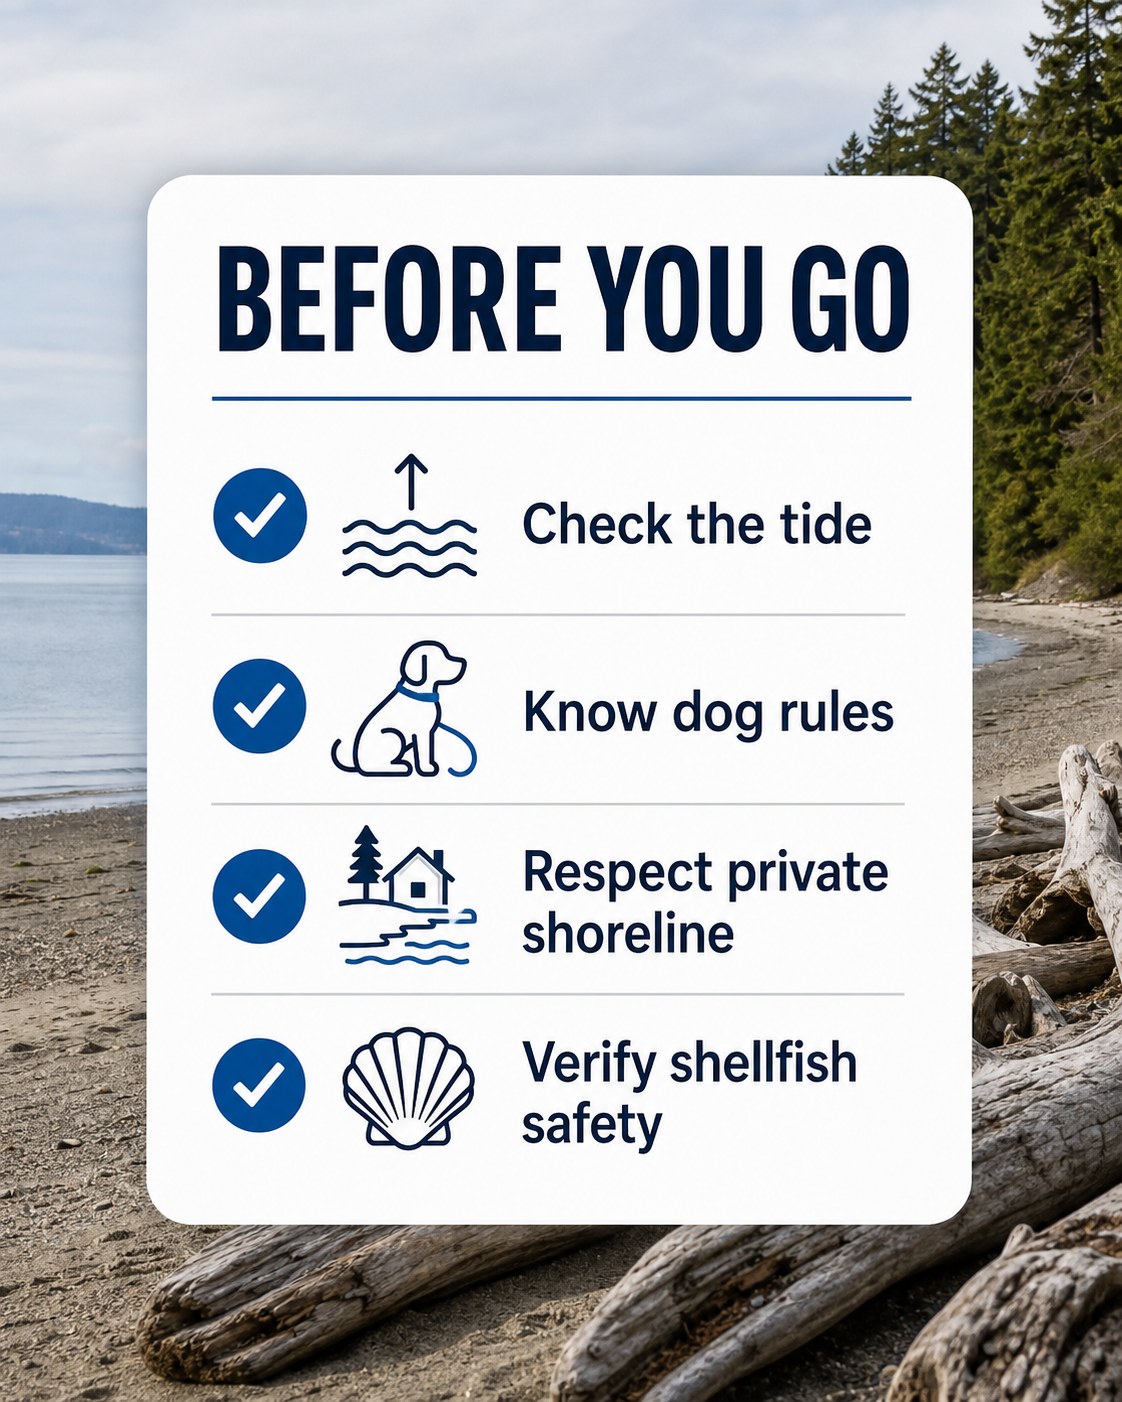
Before You Go: Four Checks That Save the Day
Whidbey beach access is not complicated, but it is local. The details matter: tide timing, dog rules, shellfish closures, parking, passes, and where public access ends. A few minutes of checking can prevent a frustrating trip.
1. Check the tide
NOAA keeps current online tide predictions, and that is a better source than memory or a stale screenshot. Low tide can make a beach feel spacious and walkable; high tide can narrow the usable shoreline, cover tide flats, or make driftwood areas harder to navigate. Use the NOAA tide tables before planning a long beach walk or low-tide outing.
2. Know dog rules
Dog rules vary by location. At Double Bluff, FETCH notes that the off-leash area begins about 500 feet from the parking lot, with dogs required to stay leashed until the marked boundary. State parks generally require dogs to be on leash. Check the specific park or access point before turning a beach walk into a dog outing.
3. Respect private shoreline
Public access and private shoreline can sit close together on Whidbey. Island Beach Access describes public/private shoreline boundaries as a common point of confusion for walkers and boaters. Use signed access points, stay aware of boundaries, and avoid assuming that every beach-looking stretch is open to public use.
South Whidbey: Sandy Walks, Family Parks, and Dog-Friendly Planning
South Whidbey has some of the island’s most approachable beach-day choices, especially if you are coming through Clinton, staying near Freeland, or building a day around local food, farms, and small-town stops. For trip pairing, the Whidbey farmers markets and farm stands guide can help you turn a beach walk into a picnic day.
Double Bluff
For many people, Double Bluff is the South Whidbey beach that comes to mind first. Island County describes it as a popular beach with an off-leash area, iconic views, and a wide shallow beach. It is a strong fit for long walks, big-sky views, and dog owners who understand the boundary rules.
The important detail: off leash does not mean off leash from the parking lot. FETCH notes that dogs must be leashed until the off-leash area begins, and that the boundary is marked near the beach. That makes Double Bluff excellent for dog people who plan well, but less ideal for anyone expecting instant off-leash freedom the second the car door opens.
Freeland Park is more practical than dramatic, which is exactly why it belongs in a beach access guide. Island County lists amenities including a boat ramp and dock for non-commercial use, picnic areas, restrooms, playground, walking trails, and clamming when in season. For families or multi-generation groups, amenities can matter more than scenery.
Maxwelton Park is another useful South Whidbey option, especially for people who want beach access with park infrastructure. Island County lists beach access, restrooms, picnic shelters, a playground, ballfield facilities, and views toward the shipping lanes, Olympic Mountains, and Kitsap Peninsula. It is a better fit for a planned gathering than a remote shoreline wander.
If you are comparing South Whidbey communities as part of a move, the Clinton guide and Freeland guide can help connect beach access with everyday life, ferry timing, services, and neighborhood feel.
Central Whidbey: Bluffs, History, and Westside Views
Central Whidbey beach access often feels more layered: historic landscapes, bluff trails, state park rules, west-facing water, and changing weather. This is the part of the island where a beach day can become a hike, a history stop, or a sunset plan.
Ebey’s Landing
Ebey’s Landing is one of Whidbey’s signature bluff-and-beach experiences. The National Park Service describes the Bluff Loop Trail as a moderate beach-and-bluff walk with a few steep sections, marine ecosystems, views across the strait, and Perego’s Lake. It is not the simplest beach for every visitor, but it is one of the strongest choices when the goal is landscape, movement, and a sense of place.
Fort Casey Historical State Park combines beach exploration with military batteries, Admiralty Head Lighthouse, picnic areas, fishing, boating, and wide Admiralty Inlet views. Washington State Parks lists dogs as allowed on leash and shows standard state park fees, including Discover Pass requirements. It is a strong Central Whidbey choice when the group wants more than shoreline alone.
For more Central Whidbey context, use the Coupeville guide, especially if you want to pair Fort Casey, Ebey’s Landing, Penn Cove, and Front Street into one slower day.
North Whidbey: State Parks, Sunsets, and Bigger Water
North Whidbey beach access often feels more open and wind-shaped. It can also be more state-park-oriented, which means passes, leash rules, seasonal hours, and official park alerts matter.
Fort Ebey
Fort Ebey State Park is a coastal camping park with a historic military fort, wooded trails, bluff views, and beach exploration. Washington State Parks lists 25 miles of wooded trails and notes that visitors can explore the beach, surf, picnic, and take in views of the Olympic Mountains, Vancouver Island, and the Strait of Juan de Fuca. Dogs are allowed on leash, and a Discover Pass is part of the normal parking picture.
Joseph Whidbey State Park is a day-use park on the west shore of Whidbey Island. State Parks describes it as a place for sunsets, moderate trail hiking, picnicking, and beach time with kids. It is seasonal, with summer hours listed as 8 a.m. to dusk and winter closure from November 1 through March 31, so check the park page before using it as a shoulder-season destination.
For broader North Whidbey planning, the Oak Harbor guide is a good companion, especially if you are comparing parks, everyday services, Navy-area realities, and access north through Deception Pass.
Public Access, Private Shoreline, and Owning Near the Water
Beach access is not only a visitor question. It also matters when people are thinking about buying, selling, or owning near the water on Whidbey. Two homes can both feel close to the shoreline while offering very different realities: private tidelands, community beach access, public road-end access nearby, bluff conditions, erosion considerations, septic and well systems, or rules that affect how the shoreline can be used.
That is why local due diligence matters. If a listing mentions beach access, waterfront, tidelands, community beach, boat launch, or shoreline amenities, ask what those words mean in practice. Is access deeded, shared, public, private, seasonal, tide-dependent, or governed by a community association? Is the trail or stairway maintained? Are there bluff, drainage, erosion, septic, or insurance considerations?
A Whidbey shoreline setting can be beautiful, but the details matter: access, bluff conditions, septic, wells, roads, insurance, association rules, and long-term maintenance. Local guidance helps turn a pretty view into a clear decision.
It depends on the day. Double Bluff is a strong choice for sandy walks and dog planning, Ebey’s Landing is excellent for a bluff-and-beach hike, Fort Casey and Fort Ebey pair shoreline with state park scenery, and Freeland or Maxwelton can be more practical for picnics and family park amenities.
Are dogs allowed on Whidbey beaches?
Dogs are allowed at many Whidbey beach areas, but rules vary. Double Bluff has a marked off-leash area, while Washington State Parks generally require dogs to be on leash. Always check the current rule for the specific access point before you go.
Do I need a Discover Pass for Whidbey beaches?
You need a Discover Pass when parking at Washington State Parks and certain state-managed recreation lands. Fort Casey, Fort Ebey, Joseph Whidbey, South Whidbey State Park, and Deception Pass are state park examples where pass planning matters.
Should I check tides before going to a Whidbey beach?
Yes. Tide timing can change how much beach is usable, especially for long walks, tide flats, driftwood areas, and shellfish-related outings. NOAA tide predictions are the best starting point.
Can I harvest shellfish on Whidbey beaches?
Only when the beach, species, season, license requirements, and health status allow it. Check Washington State Department of Health, Island County, and WDFW resources immediately before harvesting. Conditions and closures can change quickly.
Image note: The visuals in this article are editorial guide images created to explain Whidbey beach access planning. They are not documentary photos from a specific park, beach, event, property, or access point.
June on Whidbey Island is when the calendar starts to feel fully awake. Farmers markets are in rhythm, galleries and stages are busy, Pride celebrations bring neighbors together, and the first real stretch of summer weekends starts to fill with music, walks, markets, and outdoor gatherings.
This guide is built as a practical June planning companion, not a flat calendar dump. Use it to find the kind of weekend you want: arts and performance, farmers markets, Pride and community gatherings, live music, thoughtful local talks, or family-friendly outdoor events.
Quick Takeaways
June opens with a busy first weekend of art, Pride, live music, markets, WICA performances, and gallery receptions.
WICA’s New Works June runs June 4-14 in Langley, giving the month a strong performing arts anchor.
Pride events happen across the island in Oak Harbor, Coupeville, and South Whidbey.
Farmers markets are running weekly in Bayview, Coupeville, Oak Harbor, and South Whidbey.
Several events are date-specific or reservation-based, so confirm details directly before heading out.
Start Here: The First Weekend of June
The first few days of June are unusually full, especially around Langley and Clinton. If you only have one weekend to get out, June 4-7 is the one with the densest mix of arts, music, galleries, Pride gatherings, markets, and community events.
June is a good month to feel the difference between Whidbey’s communities: Langley’s walkable arts scene, Clinton’s ferry-side access, Freeland and Bayview’s everyday South Whidbey rhythm, Coupeville’s historic waterfront, and Oak Harbor’s North Whidbey energy.
WICA’s New Works June returns with staged readings, original performance, modern dance, artist conversations, and post-show talkbacks. The festival opens June 4 with Opening Night: Who Are We?, an evening of new modern dance by Meander Dance Collective with guest artist Khairat Salum and her installation Space/Spa(ces).
The festival also includes solo theatrical work, staged readings, artist conversations, and a June 11 Island Shakespeare Festival world-premiere staged reading and conversation for Robin Hood of Sherwood Forest, a new work by Erin Murray.
Meander Dance Collective presents new dance works exploring the question “Who Are We?” with special guest artist Khairat Salum. Her installation Space/Spa(ces) will be on display in Zech Hall for the evening shows. Meander Dance Collective is a program of the Whidbey Island Arts Council.
Hosted by The Commons Cafe & Books and connected with Isle Chronicles, this first-Friday open mic welcomes original work, works in progress, spoken word, acoustic music, collaborations, and broad definitions of poetry.
Whidbey Art Gallery’s June Art Walk features guest artist Tim Welsh, featured 3D artists Johnathan and Jandellyn Ward of Winfield Designs, featured 2D artist Doug Hansen, and an art demonstration by paper collage artist Paula Pugh of Unique Beaks. The gallery is open daily from 10:00 a.m. to 5:00 p.m.; the June Art Walk adds the chance to meet artists, explore the stories behind the work, and enjoy an evening gallery setting.
(De) Compositions Exhibit Reception at Koneksi Gallery
Koneksi Gallery opens Venessa Greenheron’s exhibit (De) Compositions, an interactive exploration at the intersection of death and art. The reception is accompanied by the Whidbey Bedside Singers, and the exhibit runs June 6-30 with visual, 3D, and textile artwork.
Markets, Local Food, and Weekend Loops
June is prime market season on Whidbey. If your weekend is built around food, flowers, local crafts, or a slower morning, start with the markets and then add nearby beaches, galleries, coffee, or music.
June brings Pride gatherings across the island, each with a different local feel. Confirm route, parking, and timing with event organizers before you go, especially if you are trying to pair Pride events with ferry travel, markets, or dinner reservations.
Zan Fiskum returns to the Dancing Fish Barn stage with her full band for an Americana/Folk evening. The event is reservation-only and includes a shared appetizer board served to the table. Because seating in the barn is limited, reserve early and contact the venue if you want to be seated with friends.
Ott & Hunter Winery Tasting Room: Kevin Jones & Doyle Wood
Kevin Jones and Doyle Wood return to Ott & Hunter with originals, inspired covers, mandolin, multi-instrumental arrangements, and an easy chemistry shaped by decades of shared musical history. Tickets are available through Ott & Hunter’s event listings.
Upcoming June Music at The Top Restaurant & Lounge
Goosefoot’s Bayview Corner Summer Street Dances return every other Wednesday beginning June 10. These are relaxed South Whidbey community evenings with live music, dancing, and a strong local gathering-place feel. For a deeper South Whidbey music rundown, see the South Whidbey Summer Music Guide.
Buskers on the Corner brings casual Friday evening music to downtown Oak Harbor through the summer season. It is a good low-key add-on for dinner, waterfront strolling, or a North Whidbey evening plan.
Prayerbody is a Sunday morning live-music dance gathering at Bayview Hall, offered by donation with a pay-more-when-you-can, pay-less-when-you-must spirit.
Outdoor, Family-Friendly, and Summer Weekend Ideas
Soap Box Derby at Arrowhead Ranch: Saturday, June 20, 9:00 a.m.-4:00 p.m., at Arrowhead Ranch. This is a nearby Whidbey/Camano family calendar pick rather than a Whidbey Island event, so plan the drive accordingly.
This Whidbey Climate Action program looks at Pacific salmon, clean water, urban mortality syndrome, and the chemical 6PPD-Q. Speaker Amirah Casey, a University of Washington graduate student in the School of Aquatic and Fishery Sciences, will outline the issue facing coho salmon and steelhead trout and discuss actions that can support ecosystem health.
The event notice also suggests a carpool option at Bayview Park & Ride around 5:35-5:40 p.m. for people heading toward Langley.
The Salish Sea Early Music Festival brings chamber music on period instruments to Whidbey Island, with a season spanning music from the mid-1500s through the time of Beethoven. June performances continue the festival’s Freeland dates at the Unitarian Universalist Congregation.
Bayview’s Hub Gallery adds another South Whidbey arts stop this month with Steve Eirschele’s work and a June 13 gallery talk. Pair it with Bayview Farmers Market, Bayview Corner shops, or a South Whidbey afternoon plan.
How to Plan a June Weekend Without Overloading It
June has enough going on that the best plan is usually a focused one. Pick one anchor event, then add one nearby stop. For example:
Car-free or ferry-aware plan: check ferry timing first, then keep the day concentrated in one town or part of the island.
If ferry timing is part of your day, use the Whidbey Ferry Guide 2026 before locking in a tight schedule.
Thinking About Whidbey Beyond the Calendar?
Events are one of the easiest ways to feel how different each Whidbey community can be. If June has you thinking about more time on the island, Windermere Whidbey can help you compare neighborhoods, ferry patterns, market activity, and the practical details of island living.
What should visitors check before going to a June event?
Check the event organizer’s page for current time, ticket, reservation, parking, weather, ferry, and accessibility details. Some June events are reservation-based or have limited seating.
If you are heading to Whidbey Island in summer 2026, the ferry is not just a way to get here. It is part of the planning. The right route can make the day feel easy; the wrong timing can turn a simple South Whidbey outing into a long wait at the terminal.
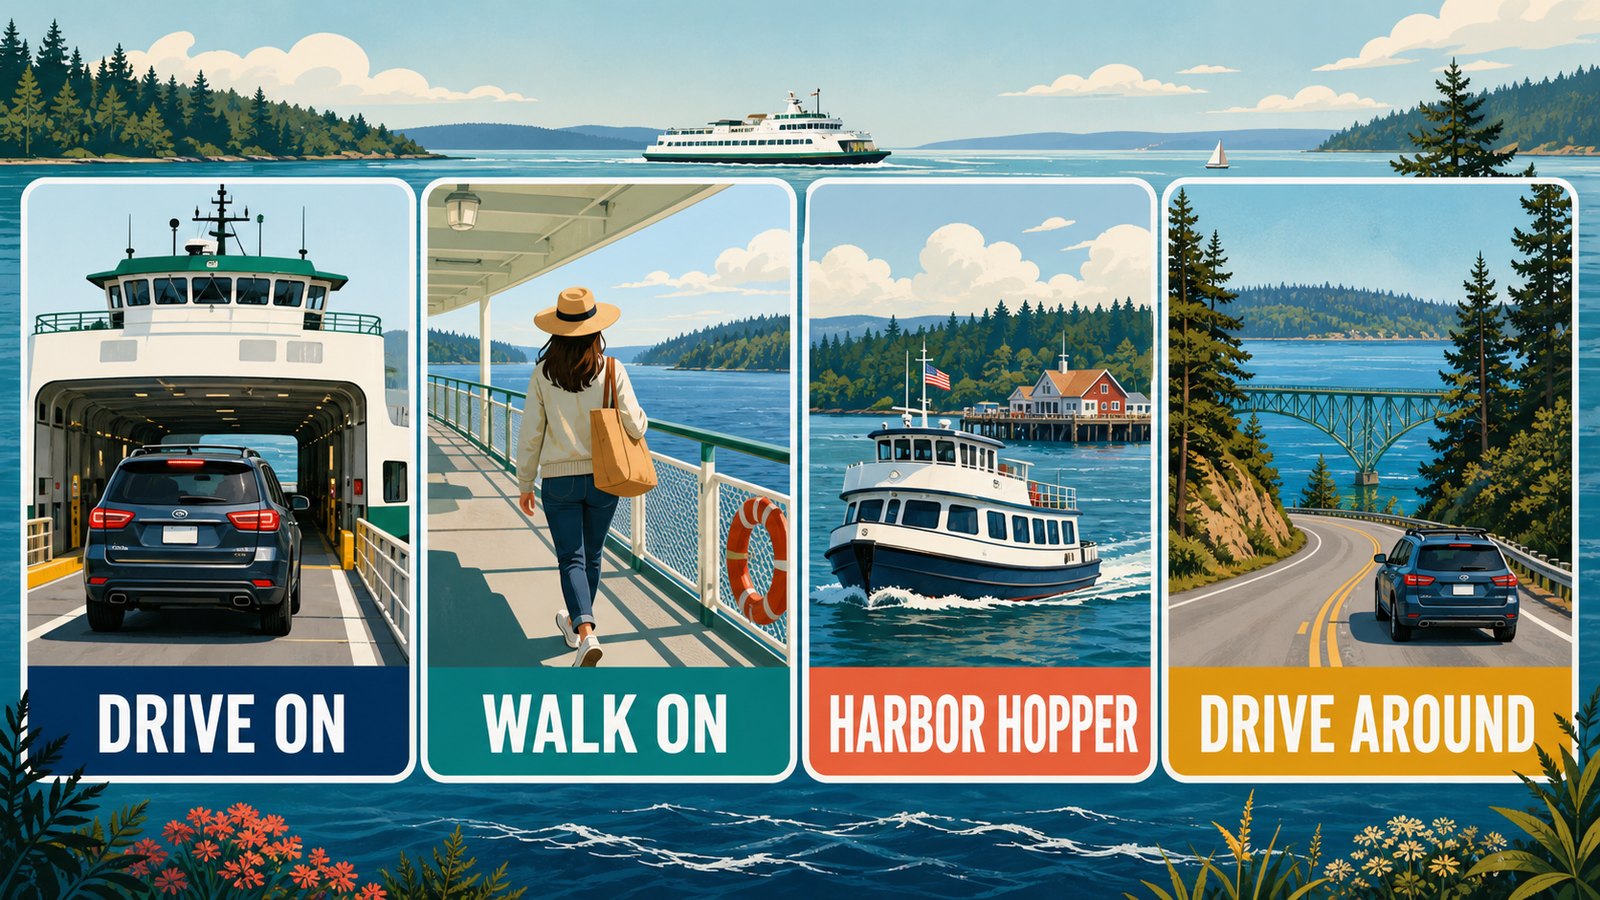
This guide is built for real trip decisions: when to use the Mukilteo-Clinton ferry, when walking on makes sense, how the new Everett-to-Langley Harbor Hopper changes summer day trips, and when a drive through Deception Pass or a Port Townsend-Coupeville reservation may be the smarter call.
Quick Takeaways
Mukilteo-Clinton is still the main South Whidbey route for most visitors driving from Seattle, Everett, Tacoma, or the Eastside.
Mukilteo-Clinton does not take vehicle reservations. Buying a ticket is not the same as saving a spot on that sailing.
The new Harbor Hopper passenger ferry is scheduled to connect Everett and Langley on select Thursdays and Saturdays from June 4 through August 29, 2026.
Use WSDOT tools before you leave home: schedule, alerts, cameras, estimated drive-up spaces, and the Best Times to Travel tool.
Build your Whidbey day around ferry timing, especially on summer Fridays, Saturdays, Sundays, and holiday weekends.
The Main South Whidbey Route: Mukilteo to Clinton
For most South Whidbey trips, the practical ferry route is Mukilteo to Clinton. It connects the mainland at Mukilteo with Clinton on the south end of Whidbey Island, putting you within easy reach of Clinton, Langley, Freeland, Bayview, Maxwelton, and the rest of South Whidbey.
The crossing itself is short, but the full trip depends on traffic, ferry line length, sailing schedule, and whether you are driving or walking on. WSDOT’s current Mukilteo-Clinton route page is the best place to check the live schedule because schedule seasons change throughout the year.
WSDOT notes there is no parking available at the Mukilteo ferry terminal itself. Nearby paid parking is limited, so long walk-on trips may require a park-and-ride or transit plan before you get to Mukilteo.
One nearby paid option to know about is the Humphrey Road Ferry Parking Lot, located up the hill on the bluff with stairs that lead down toward the ferry area. Check current signs, rates, hours, and stair/access comfort before relying on it for a specific sailing.
Planning More Than a Visit?
Ferry timing, commute patterns, and route choices matter when Whidbey becomes more than a day trip. If you are comparing island communities or watching for the right home, Windermere Whidbey can help you connect the travel reality with the neighborhoods, homes, and daily rhythms that fit your plans.
This is one of the easiest places for visitors to get tripped up.
You cannot make a vehicle reservation for the Mukilteo-Clinton ferry. WSDOT’s ticket page says vehicle reservations are available only on the Anacortes/San Juan Islands/Sidney B.C. and Port Townsend-Coupeville routes. Mukilteo-Clinton is first-come, first-served.
If you are using the Port Townsend-Coupeville route, reservations are a different story. That route is often useful for Olympic Peninsula trips and Central Whidbey plans, and reservations are strongly worth checking before you build a day around it.
How Much Does the Mukilteo-Clinton Ferry Cost in 2026?
Ferry fares can change by season, rider type, vehicle size, payment method, and tariff updates, so always use the WSDOT fare calculator before you travel.
As a snapshot checked on May 27, 2026, WSDOT listed these Mukilteo-Clinton fares:
Adult passenger, age 19-64: $7.10.
Senior/disability passenger: $3.55.
Youth age 18 and under: no charge when not driving.
Standard vehicle under 22 feet plus driver: $16.30.
Vehicle under 14 feet plus driver: $12.95.
Adult bicycle surcharge: $1.00.
Motorcycle and driver: $7.35.
On the Mukilteo-Clinton route, WSDOT states that passenger and vehicle/driver fares are collected at Mukilteo, while vehicle/driver-only fares are collected at Clinton. Translation for many day-trippers: pay close attention to direction, vehicle size, and who is traveling with you.
How to Check Ferry Wait Times Before You Go
The ferry line can change faster than a static blog post can keep up with it, so use live tools instead of relying on someone’s old weekend memory.
Low-tide warnings, especially if you are driving a large or low-clearance vehicle
One important detail: WSDOT’s estimated drive-up spaces are estimates. WSDOT notes they do not include vehicles already queued before the tollbooth, so the cameras are useful context when the terminal area is busy.
Best Ferry Strategy for Summer Weekends
Summer ferry strategy is less about finding one magic sailing and more about giving yourself options.
If you are driving onto the Mukilteo-Clinton ferry, plan around the ferry instead of treating it like a bridge. Friday afternoons, holiday weekends, sunny Saturdays, and Sunday return windows can all be busy. WSDOT recommends that vehicles on most routes be at the tollbooth at least 20 minutes before sailing, but busy summer travel can require more margin than that.
A few local planning habits help:
Check the route schedule and terminal cameras before leaving home.
Travel earlier in the day when you can.
Avoid stacking a hard dinner reservation, event start time, or appointment right after your planned ferry arrival.
Have a walk-on, transit, or drive-around backup if the line is already longer than expected.
If you are visiting for an event, read event parking and shuttle notes before assuming you need a car all day.
For more South Whidbey summer planning, the South Whidbey Summer Music Guide pairs well with this ferry guide, especially if you are planning around Bayview, Langley, Freeland, or fairgrounds-area events.
New for 2026: Everett to Langley on the Harbor Hopper
According to the Port of Everett, Harbor Hopper is a foot-ferry service aboard the chartered Hat Island Ferry. It is scheduled to run on select Thursdays and Saturdays from June 4 through August 29, 2026, with two roundtrip sailings on operating dates. Each trip is expected to take about 30 minutes, with capacity for 45 passengers.
The Port lists one-way tickets at $12 and round-trip tickets at $20. Published operating dates include select dates in June, July, and August, but passengers should book and confirm through the Port of Everett before planning around a specific sailing.
Who Harbor Hopper Fits Best
Everett-area visitors who want a car-free South Whidbey day trip.
People planning a walkable Langley outing.
Visitors who want to avoid summer vehicle ferry lines.
Anyone pairing the ferry ride with downtown Langley, South Whidbey Harbor, galleries, food, theater, or summer music.
Who May Still Need a Car
Families carrying beach gear, coolers, or bulky items.
Visitors trying to cover multiple parts of the island in one day.
Travelers headed to beaches or parks that are not easy to reach by foot or transit from Langley.
Anyone whose return timing does not line up with the limited pilot schedule.
South Whidbey Harbor’s public dock and wharf put Harbor Hopper passengers close to Langley’s waterfront, shops, restaurants, galleries, and performing arts. The Port of South Whidbey also notes that the harbor has accessible restrooms, beach access, accessible fishing, and other visitor facilities.
Can You Visit Whidbey Without a Car?
Sometimes, yes. But the best car-free Whidbey trip is a focused trip.
If you walk onto the Mukilteo-Clinton ferry, Island Transit is the key on the Whidbey side. Island Transit is fare-free, and the agency notes that buses in Clinton are parked alongside the terminal building where walkers exit the ferry.
For Langley, the Port of South Whidbey and Island Transit visitor information point travelers from the Langley marina area toward the bus shelter at Anthes and 3rd, where Route 60 can connect to more of South Whidbey. Always confirm the current route and schedule before relying on it, especially for evening returns.
Car-free works best when your plan is simple: walkable Langley, a pickup from someone local, a transit-friendly stop, or a Harbor Hopper day focused around South Whidbey Harbor. It works less well when your itinerary includes multiple beaches, farm stands, parks, and dinner reservations spread across the island.
Should You Drive Around Through Deception Pass?
Driving around through Deception Pass can make sense, especially if you are coming from the north or heading to Oak Harbor, Deception Pass State Park, or North Whidbey. It can also be a backup when ferry lines are unusually long and you are not tied to South Whidbey first.
For a quick Langley, Clinton, Freeland, or Bayview trip from Seattle or Everett, though, driving around is often a bigger commitment. You are trading ferry uncertainty for highway miles, I-5 timing, and a much longer land route. It may be beautiful, but it is not automatically faster.
A good rule of thumb: if your destination is South Whidbey and the ferry line is manageable, Mukilteo-Clinton is usually the natural route. If your destination is North Whidbey, or if you are already north of Everett, Deception Pass deserves a closer look.
Where to Go After You Arrive
Keep the first stop realistic. If you arrive in Clinton, you are already at the island’s ferry gateway; the Clinton guide is a helpful local companion for nearby beaches, ferry-area context, and South Whidbey access.
If you are headed toward Langley, give yourself time to slow down. The Langley guide is the better resource for town-by-town detail, while this article stays focused on getting here without ferry stress.
Ferries are part of daily life here, not just a visitor detail. If you are considering a move, second home, or more time on the island, it helps to understand how ferry timing, wells, septic systems, insurance, shoreline settings, and neighborhood access shape real ownership decisions.
Do you need a reservation for the Mukilteo-Clinton ferry?
No. WSDOT vehicle reservations are not available for Mukilteo-Clinton. The route is first-come, first-served.
Does buying a ferry ticket guarantee a spot?
No. WSDOT says a ticket does not guarantee a spot on a ferry. Tickets are fares, not reservations.
How long is the Mukilteo-Clinton ferry ride?
The crossing is short, but total trip time depends on the sailing schedule, terminal wait, traffic, and loading. Check the current WSDOT route schedule before leaving.
How much does the Whidbey ferry cost?
Fares vary by route, vehicle size, rider type, and travel date. As of May 27, 2026, WSDOT listed Mukilteo-Clinton adult passenger fare at $7.10 and standard vehicle under 22 feet plus driver at $16.30. Always recheck WSDOT before travel.
What is the Harbor Hopper?
Harbor Hopper is a 2026 passenger ferry pilot between Everett and Langley, operated aboard the chartered Hat Island Ferry on select Thursdays and Saturdays from June 4 through August 29, 2026.
Can you visit Langley without a car?
Yes, if your plan is focused and your schedule lines up. Harbor Hopper brings passengers directly to South Whidbey Harbor in Langley on select dates. Walk-on ferry passengers can also use Island Transit from Clinton, but should verify current routes and return timing.
When should you drive around through Deception Pass?
Driving around can make sense if you are coming from the north, heading to North Whidbey, or trying to avoid a very long South Whidbey ferry line. For most Seattle/Everett-to-South Whidbey trips, Mukilteo-Clinton is still the natural route when wait times are reasonable.
If you want to understand how South Whidbey feels in summer, follow the music. Some nights are folding chairs and picnic blankets. Some are dancing near Bayview. Some are small-room shows at a winery, bistro, taproom, or coffeehouse. Others turn into full festival weekends at the fairgrounds.
Quick Takeaways
Bayview Corner Summer Street Dances run every other Wednesday, June 10 through September 2, 2026, from 6 to 8 p.m.
Freeland and Langley carry much of the small-venue music rhythm, from winery nights and intimate tasting-room shows to coffeehouse and community music.
LittleBIGFest brings a three-day music and arts festival to the Whidbey Island Fairgrounds and Events Center in Langley, August 14-16, 2026.
WICA anchors the arts-center side of the music scene, including the Whidbey Island Jazz Festival and summer programming.
Farmers markets are part of the soundtrack too, especially when you want music without planning a full evening out.
Image note: The images in this article are editorial illustrations created to represent the feel of South Whidbey summer music. They are not documentary photos from a specific event date or venue.
Start With The Bayview Street Dances
For many locals, the easiest place to start is Bayview Corner Summer Street Dances. The 2026 series runs every other Wednesday from June 10 through September 2, from 6 to 8 p.m., with a free, family-friendly, rain-or-shine setup.
Think of it less as a formal concert and more as a South Whidbey gathering habit: neighbors running into neighbors, a band setting the rhythm, kids moving through the edges, and people easing into the evening. The dance area is best understood as part of the Bayview Corner outdoor gathering zone near the Taproom side and the nursery/parking-lot area, rather than inside the historic Cash Store building itself.
That Bayview setting also makes it easy to pair music with a casual food-and-drink stop. Taproom @ Bayview Corner has its own local music and open-mic energy, which makes Bayview one of the island’s most natural summer gathering points.
South Whidbey’s Small-Venue Music Lives In The Details
The best part of South Whidbey’s live music scene is that it is not all in one place. It moves through crossroads, patios, tasting rooms, coffeehouses, community halls, and restaurants. That is what makes it feel local.
In Clinton, Bailey’s Corner Store has become a true neighborhood stop for burgers, craft beer, comedy, trivia, karaoke, open mic nights, and live music. Nearby, Thirsty Crab Brewery is another Clinton spot to watch for music and casual community events.
In Freeland, the music cluster has grown stronger. Leo & Leto’s notes live music every Saturday night, while The Barnyard brings a smokehouse/taproom setting with live music through the warmer season. Dancing Fish Vineyards is one of the strongest winery-music anchors, especially with its Thursday Music Nights and outdoor-event feel.
Freeland also has a growing music-community layer beyond traditional venues. Jupiter Coffee has been building a local gathering feel, including Jupiter Nights and occasional live music. The emerging Freeland Music Hub, Blue Sound Music, and Whidbey Island School of Music and Dance cluster points toward something deeper: not just places to listen, but places where people learn, rehearse, gather, and build music together. Freeland Hall’s music club adds another community-centered option for people who want participation, not just a seat in the audience.
Langley Has The Arts-Room Side Of The Scene
Langley brings a different mood. At Whidbey Island Center for the Arts, music sits inside a broader performing-arts calendar. The Whidbey Island Jazz Festival runs May 28-31, 2026, with WICA Mainstage and Zech Hall programming, and WICA’s summer nights programming keeps that arts-center feeling moving into the season.
For a more intimate Langley evening, Ott & Hunter adds the waterfront tasting-room side of the scene: smaller, moodier, and often built around a seated listening room feel. Together, WICA and Ott & Hunter give Langley both a formal performance anchor and a softer night-out option.
At South Whidbey Tilth Farmers Market and Bayview Farmers Market, music often functions as atmosphere rather than headline. It is the soundtrack to coffee, flowers, produce, a quick conversation, and a slow lap through the booths. For people new to the island, that kind of casual gathering can say as much about South Whidbey as a ticketed show.
Festival Weekends Bring Everyone Together
At the larger end of the summer music spectrum, LittleBIGFest brings music, art, vendors, food, family activities, workshops, a healing zone, and silent disco energy to the Whidbey Island Fairgrounds and Events Center in Langley. The 2026 festival is scheduled for August 14-16.
The fairgrounds also matter beyond one weekend. The Whidbey Island Fair, scheduled for July 23-26, 2026, brings another layer of summer gathering to Langley. Entertainment details can change as schedules are finalized, so check the current fair calendar before heading out.
How To Choose The Right Music Night
For a free family-friendly evening
Start with Bayview Corner Summer Street Dances or South Whidbey Parks and Rec’s Concerts in the Park. The parks series is listed for Tuesdays, 6 to 7:30 p.m., beginning July 7, with lineup details worth checking before you go.
For a date night
Look at Leo & Leto’s, Dancing Fish, Ott & Hunter, or WICA. These settings tend to feel more intentional, whether that means a seated show, a winery evening, or a performance-centered night in Langley.
For a casual local hangout
Bailey’s, The Barnyard, Taproom @ Bayview Corner, and Thirsty Crab are the kinds of places where music can be part of a broader local night out rather than the only reason to go.
For a bigger weekend
LittleBIGFest and the Whidbey Island Fair bring the fairgrounds into the center of the story, with music, vendors, food, families, and the kind of summer crowd that makes Langley feel like a shared backyard.
What The Music Scene Says About South Whidbey
The way South Whidbey gathers around music says something about its communities. Clinton has its crossroads hangouts. Bayview has its dance-and-market rhythm. Freeland is building a lively mix of food, wine, coffee, lessons, and local performance. Langley brings the arts-center, fairgrounds, and waterfront-tasting-room side of the island.
For someone visiting, relocating, or simply trying to understand where they feel most at home, these nights can reveal more than a drive-by tour. You see how people linger. You hear where conversations happen. You notice whether a place feels polished, casual, creative, family-friendly, or a little bit of everything.
Exploring Life On South Whidbey?
Local music is one way to understand the rhythm of a place. If you are comparing Clinton, Langley, Freeland, Bayview, or Greenbank, Windermere Whidbey brokers can help you connect the lifestyle details with the real estate realities.
Where can I find live music on South Whidbey in summer?
Start with Bayview Corner Summer Street Dances, WICA, Ott & Hunter, Bailey’s Corner Store, Leo & Leto’s, Dancing Fish Vineyards, The Barnyard, Taproom @ Bayview Corner, and LittleBIGFest. Farmers markets, Freeland Hall, Jupiter Coffee, and community calendars are also worth watching.
Are there free summer concerts or dances on South Whidbey?
Yes. Bayview Corner Summer Street Dances are listed as free and family-friendly. South Whidbey Parks and Rec also lists Whidbey Telecom Concerts in the Park on Tuesdays beginning July 7, with current lineup details to confirm before attending.
Is LittleBIGFest on South Whidbey?
Yes. LittleBIGFest is scheduled for August 14-16, 2026, at the Whidbey Island Fairgrounds and Events Center in Langley.
Where should I check for updated weekly music schedules?
Check each venue’s own website or social channels before heading out. Local music schedules can change with weather, staffing, artist availability, private events, and seasonal programming.
Event dates, times, venues, and programming can change. Always confirm current details with the organizer or venue before making plans.
Set near the end of a secluded cul-de-sac in Clinton View Estates, 4694 Wrightsman Place is shaped around the kind of Whidbey view that changes the rhythm of a home. From the main living spaces, the outlook reaches across the Sound toward the Cascade Mountains and Mt. Baker, giving everyday rooms a front-row connection to sunrise light, passing boats, eagles, and the possibility of whales in the water below.
Listed at $1,550,000, this 3-bedroom, 3.25-bath Clinton home offers approximately 3,795 square feet of finished living space on a 0.32-acre lot, with main-level entry, generous gathering rooms, flexible lower-level living, established landscaping, covered parking, RV parking, and workshop/storage space.
Listed by Windermere Real Estate South Whidbey
Learn More with Lynne Hunsaker
For current details, showing availability, and questions about the home’s layout, views, lower-level flexibility, or Clinton View Estates setting, connect with listing broker Lynne Hunsaker.
MLS #2520095. Built in 2000. Sound, ocean, island, and mountain views. Listing details should be confirmed with Lynne Hunsaker or a buyer’s real estate advisor before making decisions.
Where the View Leads the Home
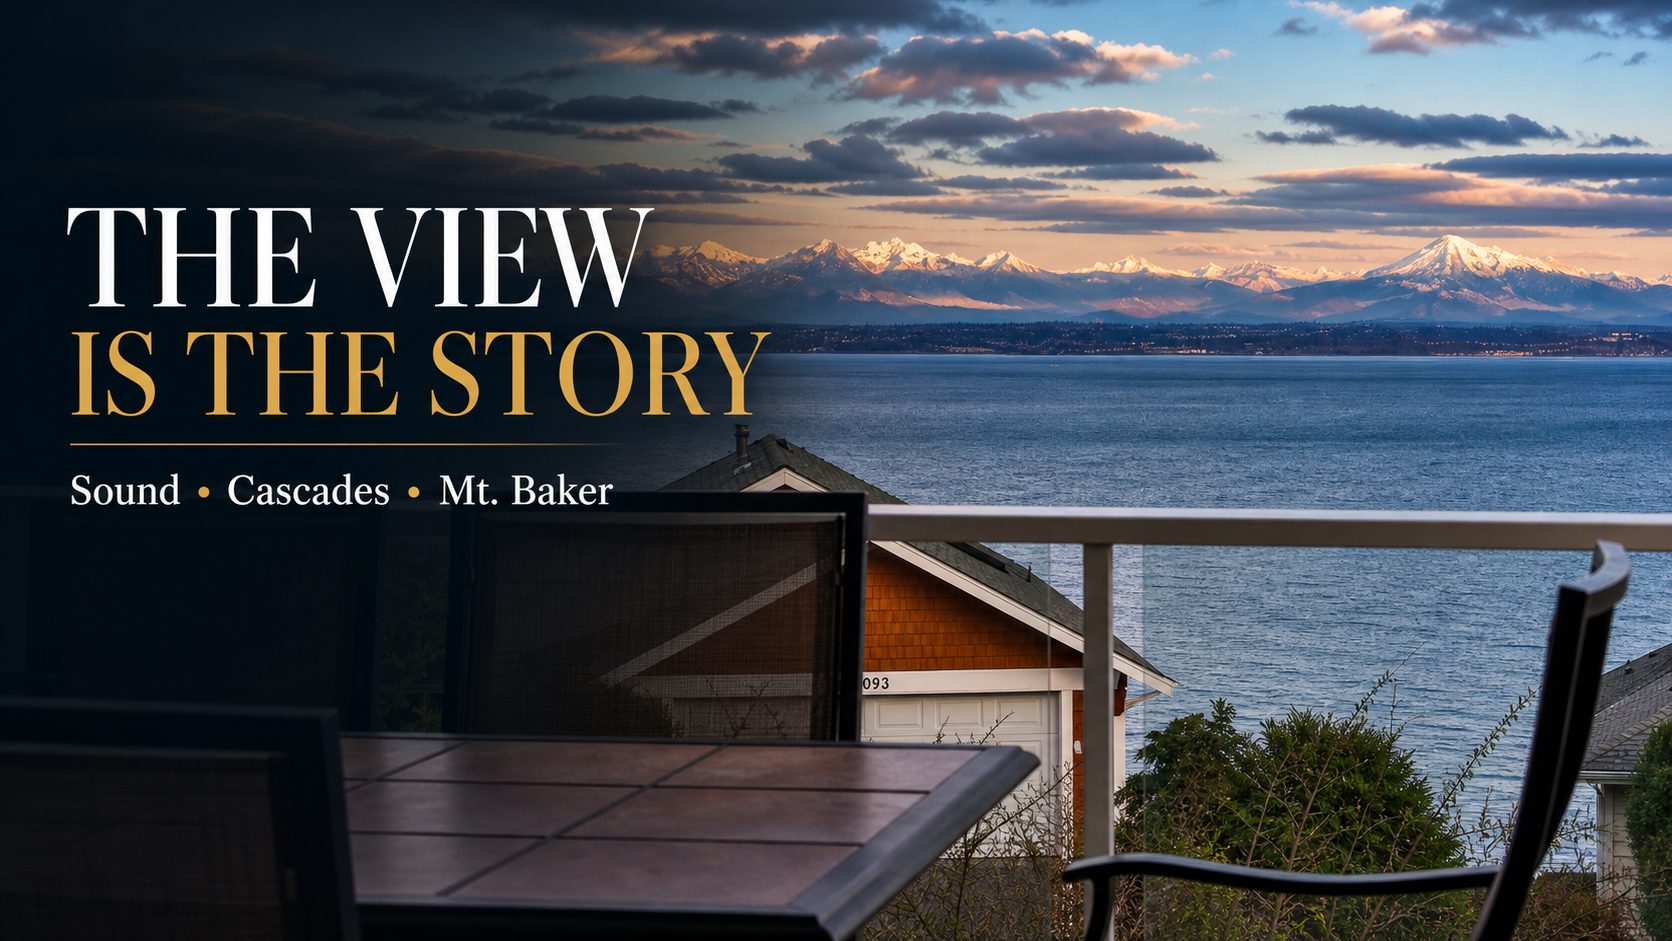
The listing describes a commanding 180-degree view of the Sound, Cascade Mountains, and Mt. Baker through an expanse of windows. That view is not tucked into one corner of the home. It is part of the daily experience from the main living areas, the primary suite, and the outdoor spaces.
The view is the story: Sound, Cascades, and Mt. Baker from 4694 Wrightsman Place.
That setting also keeps the home close to practical South Whidbey connections. From this Clinton location, you are just minutes from the Mukilteo ferry and within easy reach of Langley, while still coming home to a quieter view-oriented setting.
Main-Level Living with Big Windows and Everyday Ease
The main level is designed for easy entry and view-forward living. Vaulted ceilings, spacious rooms, and broad windows give the central gathering spaces a bright, open feel, while the kitchen, dining, and living areas stay connected for daily life and hosting.
Main-level living with vaulted ceilings, view-facing windows, and open gathering space.
The primary suite continues the same view connection, with Sound views, a sitting area, private balcony, walk-in closet, and a 5-piece bath. It gives the main level a comfortable retreat without separating the owner experience from the home’s best outlook.
A Lower Level with Real Flexibility
An interior stairwell leads to a second living space with a bedroom, kitchen, den or office area, and full bath. That layout creates options for guests, extended stays, multi-generational living, or home-office use, depending on a buyer’s needs.
Flexible lower-level living with second kitchen, guest space, and den or office potential.
Because the home has garage access on both levels, the lower level is not just bonus space. It has a more independent, usable feel, with direct access that can support a variety of household arrangements.
Outdoor Spaces with Garden Texture and Water Views
The landscaping adds another layer to the property. The listing notes several sitting areas, a water feature, and a fire pit, all set within established plantings and view-oriented outdoor spaces. It is the kind of outdoor setting that feels designed for smaller moments: morning coffee, evening light, or a quiet seat after coming home from the ferry.
Garden and patio view moments at 4694 Wrightsman Place.
The Practical Details Matter Here, Too
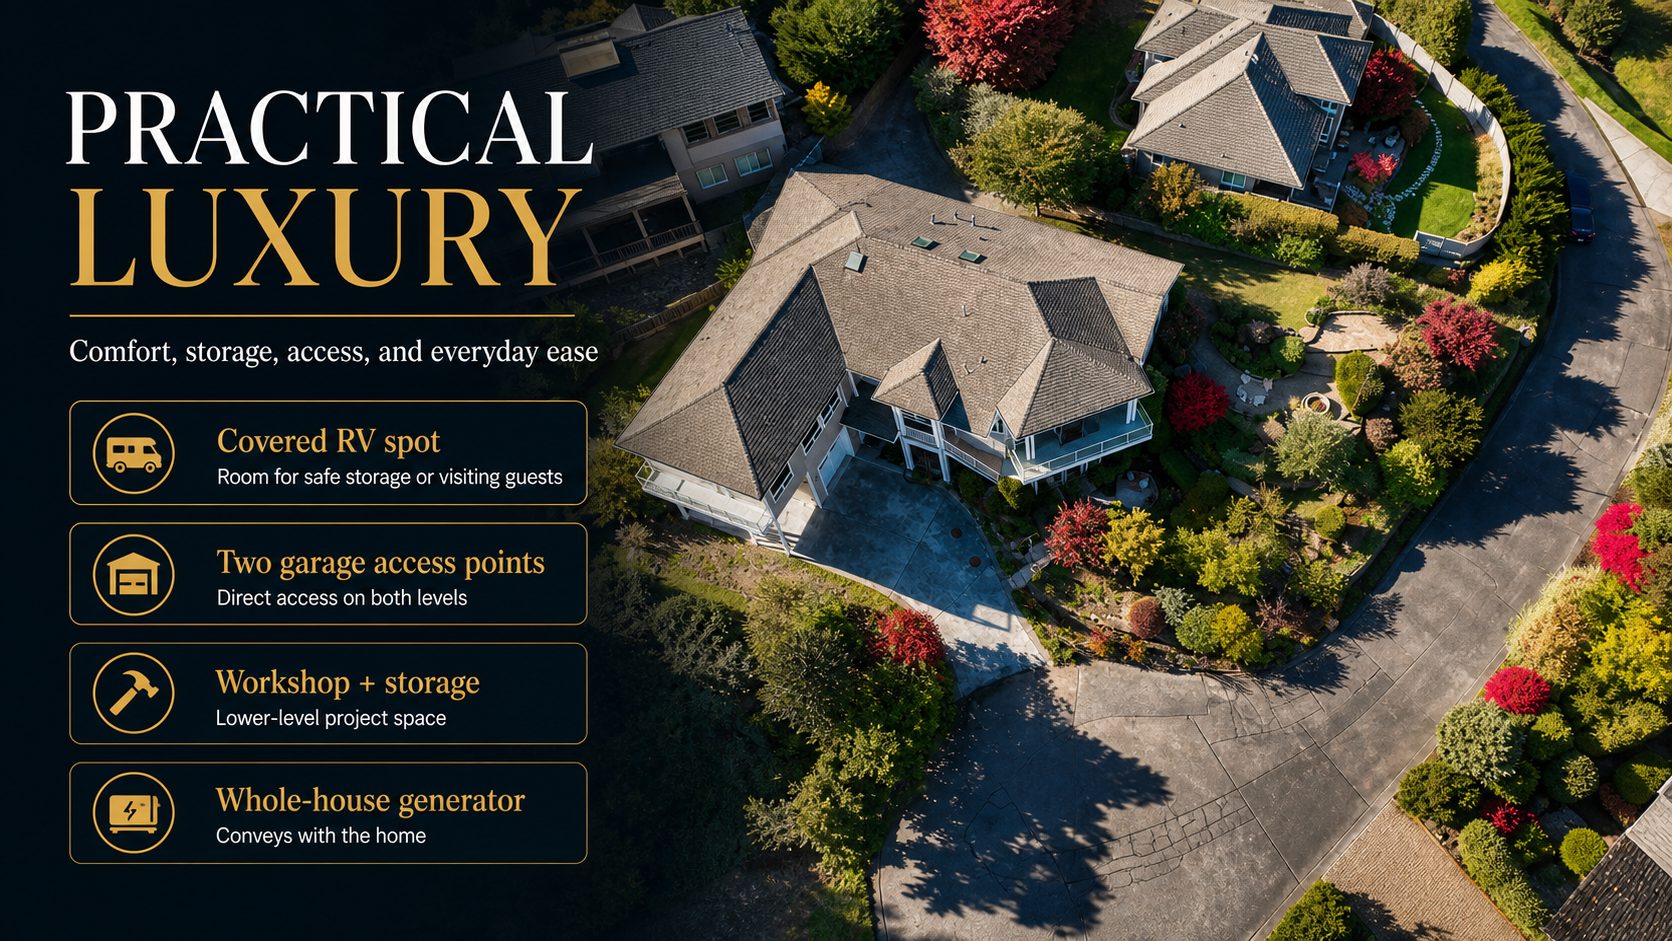
Beyond the view and living spaces, this property has practical advantages that matter on Whidbey. Two separate garage access points, covered parking, a covered RV spot, and a lower-level workshop/storage area give the home more functional depth than a typical view property. The 360 listing details also note that a whole-house generator conveys.
Practical luxury features at 4694 Wrightsman Place.
Watch the Property Video
Video note: If the video does not display after publishing, request a public or unlisted Vimeo share URL or approved embed code from the listing media source.
See 4694 Wrightsman Place
If Sound and mountain views, main-level living, flexible guest space, and practical Whidbey storage matter in your search, this Clinton View Estates home is worth a closer look.
4694 Wrightsman Place is listed by Lynne Hunsaker with Windermere Real Estate South Whidbey. Listing details, availability, price, and MLS information can change, so buyers should confirm current information with the listing broker or their own real estate advisor.
Image note: The editorial graphics in this article were created from listing photo references to support the property story. They are intended as marketing visuals, not independent documentation of property condition or exact current appearance. Buyers should rely on the listing, disclosures, inspections, and professional guidance for property decisions.
Whidbey Island’s spring real estate market is waking up. Over the last 30 to 60 days, more homes have come to market across South, Central, and North Whidbey. At the same time, buyer activity has also picked up, which means the story is more nuanced than simply saying buyers have more choices or sellers have all the leverage.
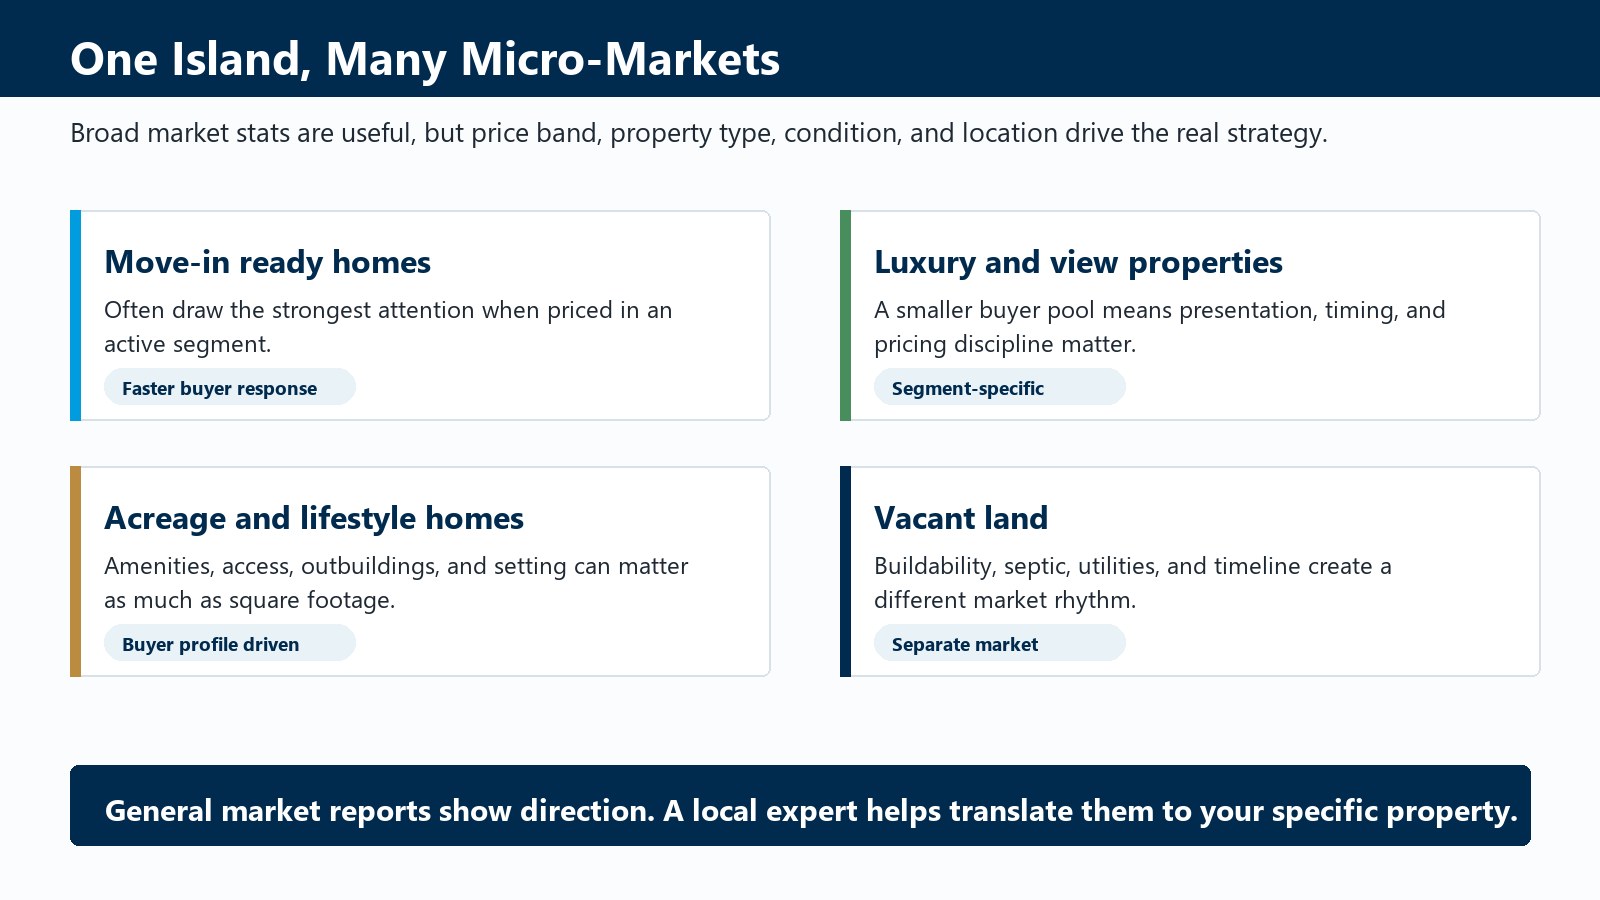
Based on April 2026 local MLS activity, the Whidbey market is best described as more balanced than overheated, but slightly seller-leaning in the right segments. Move-in ready homes, strong locations, and properties that match active buyer demand can still move quickly. Other homes, especially those that need work, are priced ahead of the market, or sit in slower price bands, may face a more selective buyer pool.
That distinction matters. A broad island-wide market report can show the general direction, but your specific result depends on the micro-market around your property: price range, condition, neighborhood, view, acreage, ferry access, lifestyle features, and current competing inventory.
Images and graphics in this article are editorial market visuals created for this update. Current listing examples are used for market context only; listing details and availability can change quickly and should be confirmed with a Windermere Whidbey broker.
Quick Local Takeaways
Inventory rose across all three Whidbey submarkets in April.
Buyer activity also strengthened, especially South Whidbey closed sales and North Whidbey pending sales.
Closed-sales months of inventory was under three months in South, Central, and North Whidbey, which creates a seller-leaning signal.
Pended-sales inventory tells a more balanced story in South and Central Whidbey.
Average sold prices rose, while median sold prices dipped slightly, which suggests the mix of homes sold had a major influence on the numbers.
Different price segments are moving at different speeds.
What Changed As The Spring Selling Season Arrived?
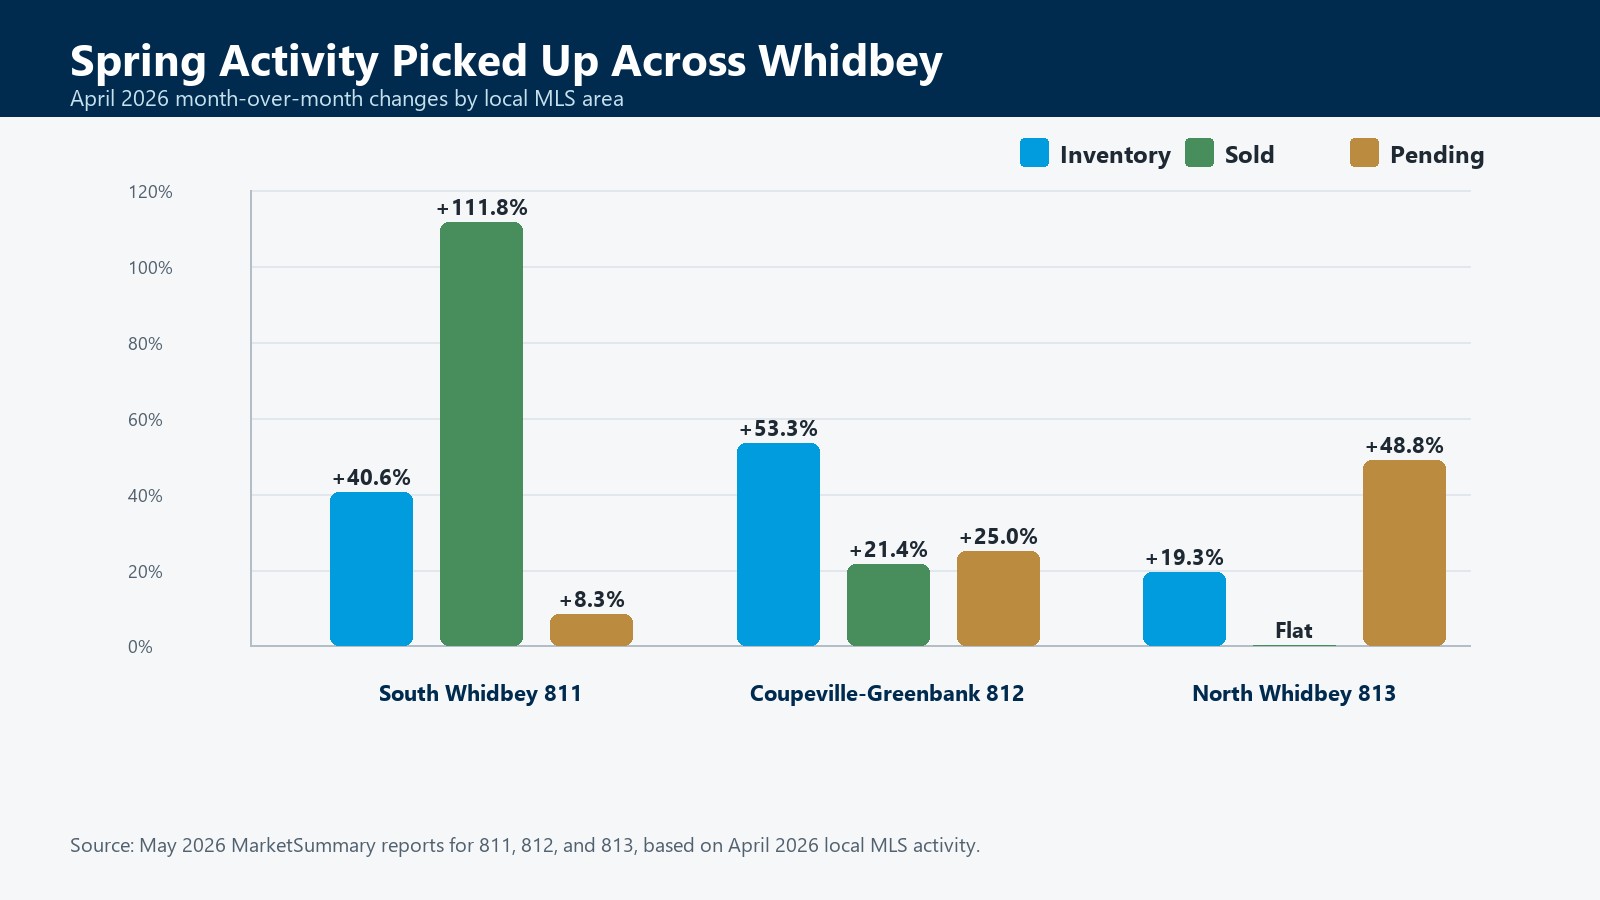
The most visible change is inventory. In April, the number of homes for sale rose 40.6% on South Whidbey, 53.3% in Coupeville-Greenbank, and 19.3% on North Whidbey. That is the spring market doing what spring often does: giving buyers more to look at and giving sellers a more active audience.
But the demand side moved too. South Whidbey closed sales rose from 17 in March to 36 in April. Coupeville-Greenbank sales rose from 14 to 17. North Whidbey closed sales held steady at 40, while pending sales jumped from 41 to 61.
That is why this market does not read like a simple buyer’s market, even with more choices available. More listings are entering the market, but enough buyers are still stepping forward to keep well-positioned properties competitive.
April 2026 month-over-month activity based on May 2026 MarketSummary reports for Whidbey MLS areas 811, 812, and 813.
Whidbey Area
Inventory Change
Sold Change
Pending Change
Closed-Sales Inventory
South Whidbey 811
Up 40.6%
Up 111.8%
Up 8.3%
2.7 months
Coupeville-Greenbank 812
Up 53.3%
Up 21.4%
Up 25.0%
2.7 months
North Whidbey 813
Up 19.3%
Flat
Up 48.8%
2.5 months
Why More Inventory Does Not Automatically Mean A Buyer’s Market
More inventory gives buyers more choices, but it does not automatically shift negotiating power to buyers. The key question is whether new listings are being absorbed by buyer demand.
In April, closed-sales months of inventory was below three months in all three local areas: 2.7 months on South Whidbey, 2.7 months in Coupeville-Greenbank, and 2.5 months on North Whidbey. By that measure, the market still leans toward sellers.
However, pending-sales inventory softens the picture in parts of the island. South Whidbey’s months of inventory based on pended sales was 3.7 months, and Coupeville-Greenbank was 3.1 months, both closer to neutral. North Whidbey was tighter at 1.6 months based on pended sales.
So the more useful read is this: Whidbey is not in a frenzied seller’s market, but it is also not a market where buyers can assume every seller is under pressure. The balance depends heavily on the property.
Price Segments Are Not Moving The Same Way
The pricing data is another reminder to be careful with broad conclusions. Average sold price rose in all three areas in April: up 6.4% on South Whidbey, 20.0% in Coupeville-Greenbank, and 8.3% on North Whidbey. Average sold price per square foot also rose in all three areas.
At the same time, median sold price declined slightly in all three areas. South Whidbey’s median sold price dipped 4.0%, Coupeville-Greenbank dipped 2.2%, and North Whidbey dipped 0.7%.
That difference between average and median is important. It suggests that the mix of homes selling in April influenced the headline numbers. A few higher-priced sales can lift averages even while the midpoint of the market is steady or slightly lower.
Broad market stats can show direction, but price band, property type, condition, and location shape the strategy for each property.
For sellers, that means pricing should be specific, not generic. For buyers, it means a broad headline may not tell you what is happening in the price band you are actually shopping.
The Practical Takeaway
Most local brokers would still describe the market as more balanced than a classic seller’s market, but slightly seller-leaning for move-in ready homes in specific segments. A well-prepared home in the right price range can still attract strong attention. A property with condition, pricing, access, or location challenges may need a more patient and strategic plan.
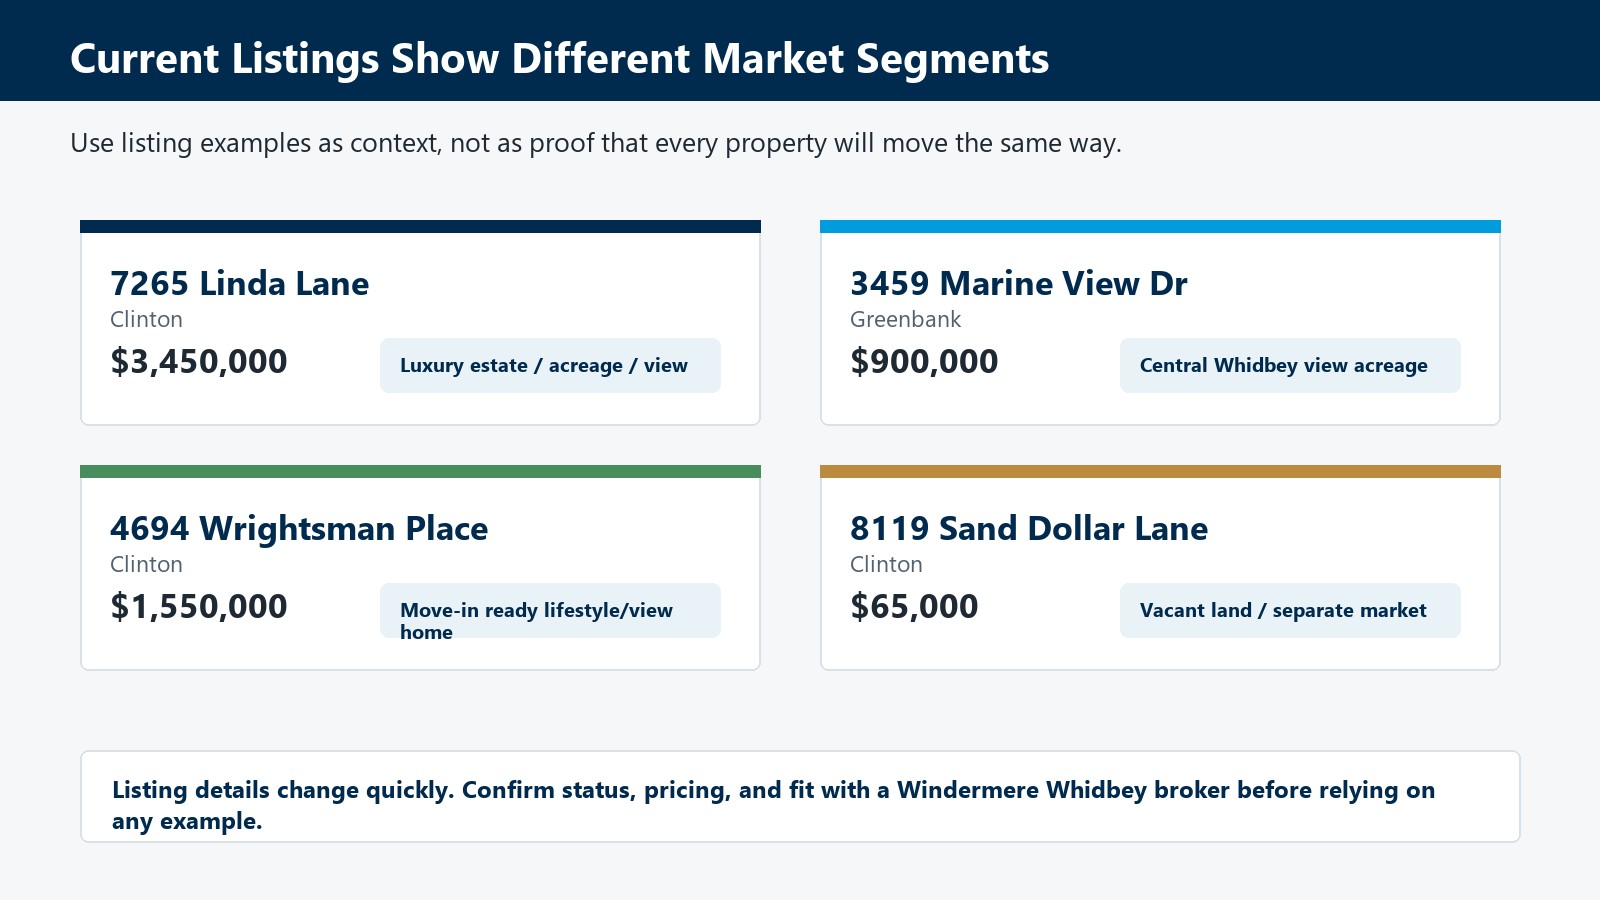
Current Listings Show Why Micro-Markets Matter
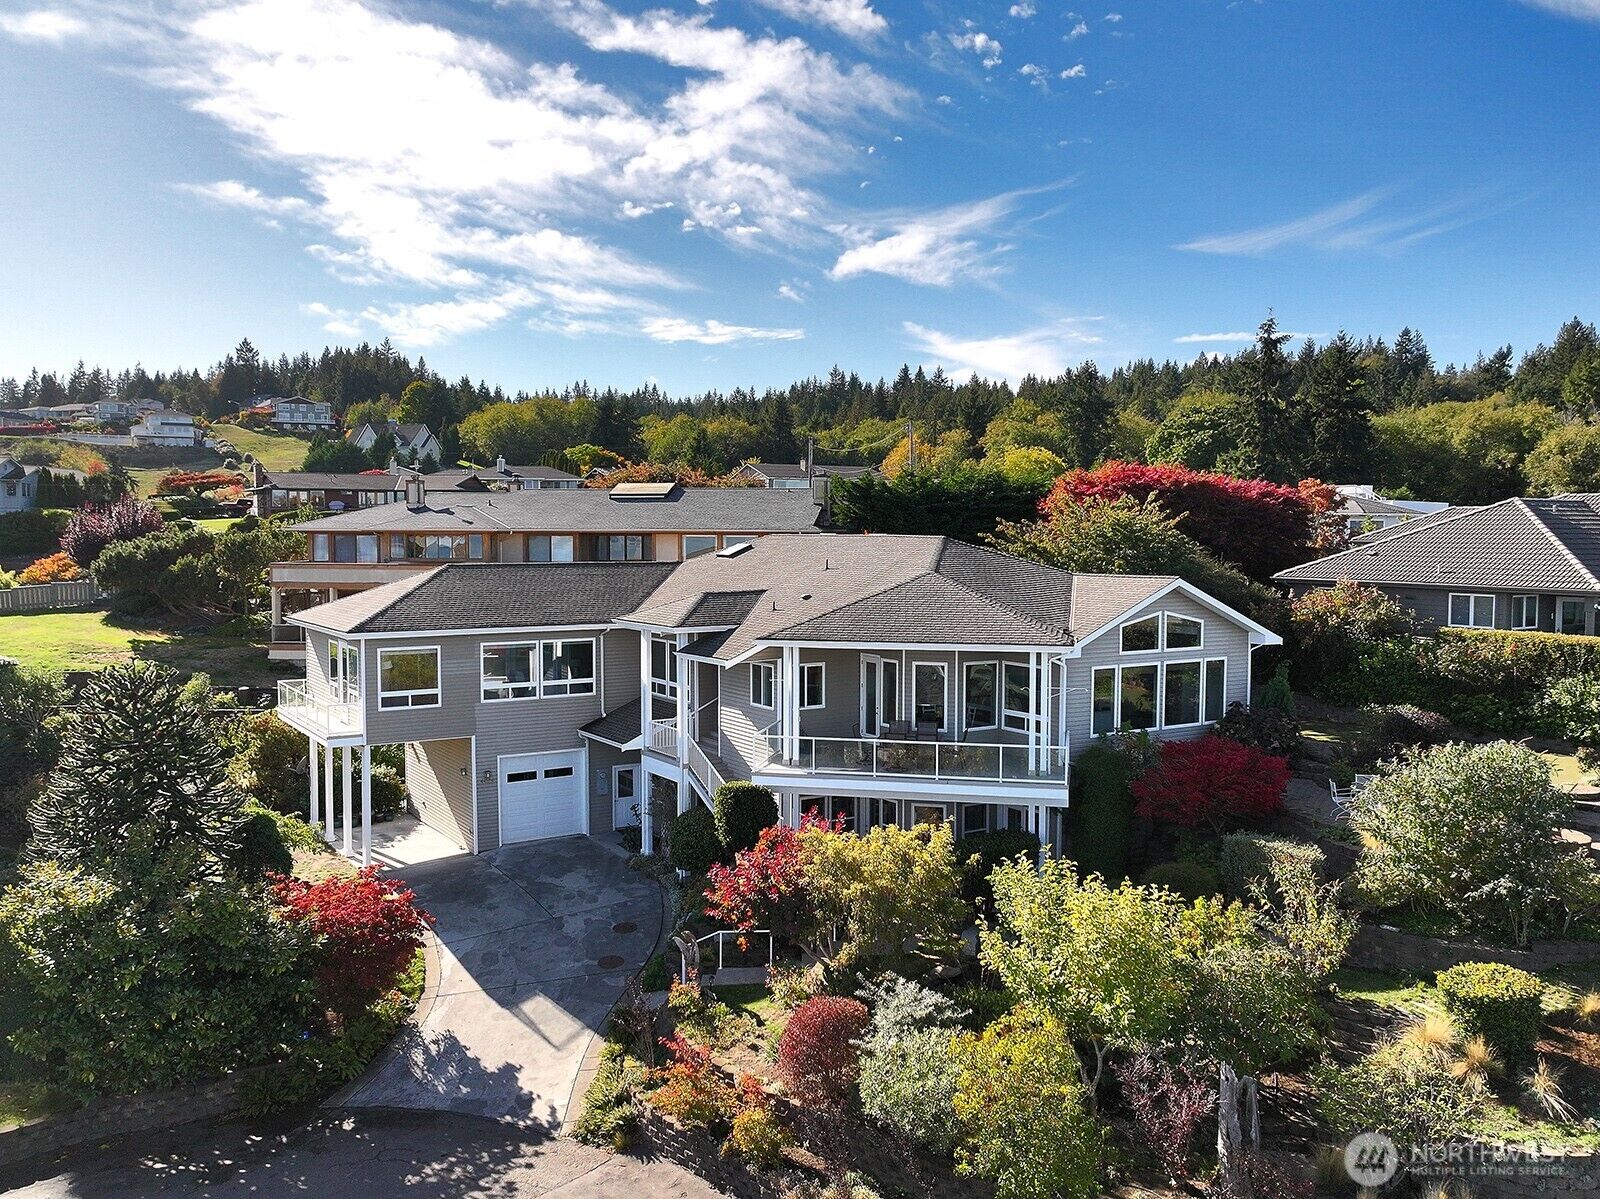
A look at selected Windermere Whidbey active listings shows how many different markets can exist on the island at the same time. These examples are not meant to suggest one universal trend; they show why property type and buyer profile matter.
Current listing examples show why Whidbey Island market conditions should be interpreted by segment, property type, and buyer pool.
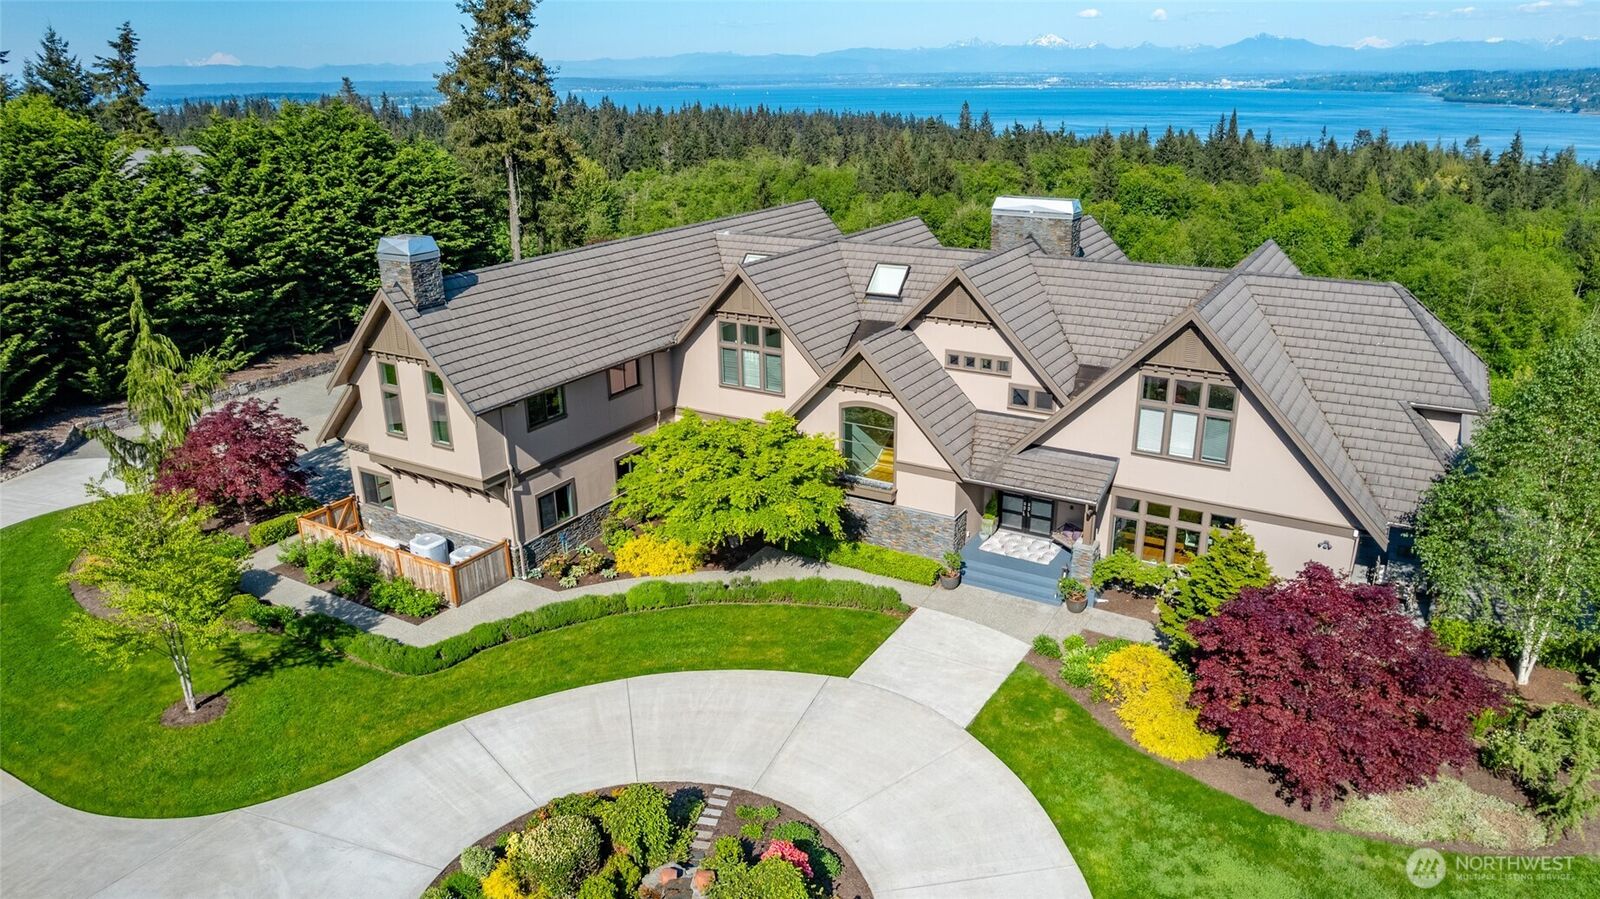
This South Whidbey estate sits in a luxury segment where acreage, privacy, views, ferry access, and high-end amenities all matter. Luxury listings should be interpreted differently than the broader resale market.
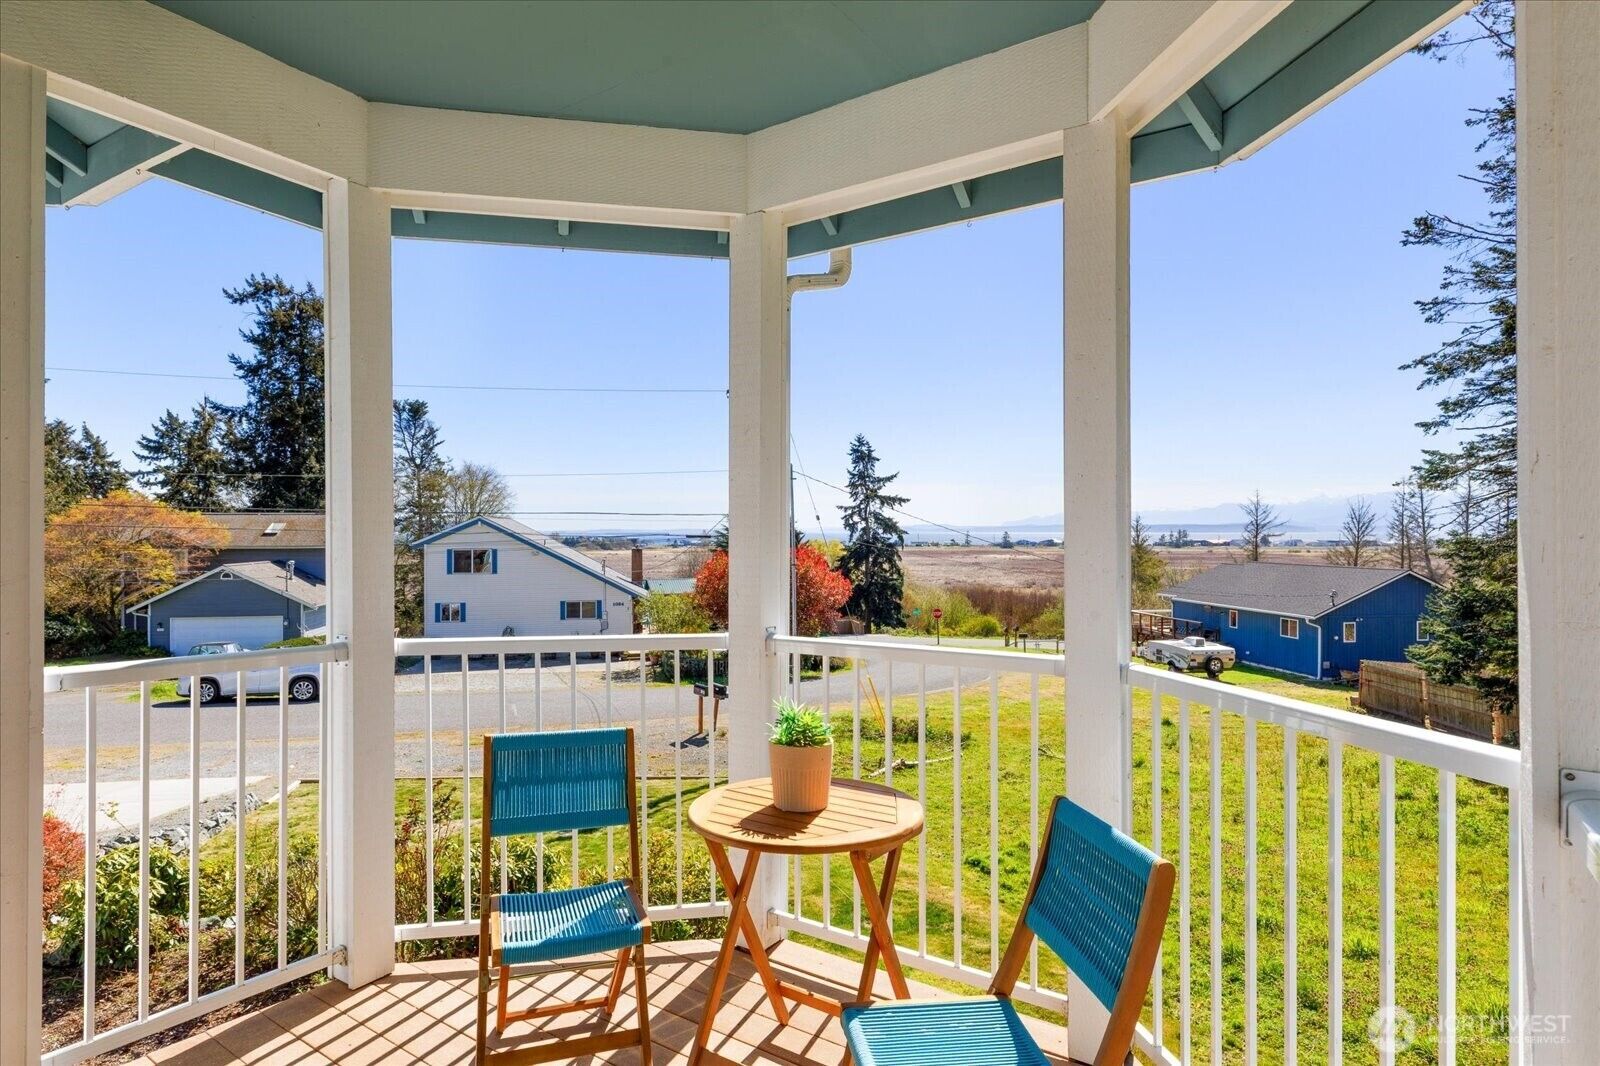
This Lagoon Point property blends view acreage, outbuildings, garden space, and community beach/boat launch amenities. Distinctive Central Whidbey properties often speak to a very specific buyer pool.
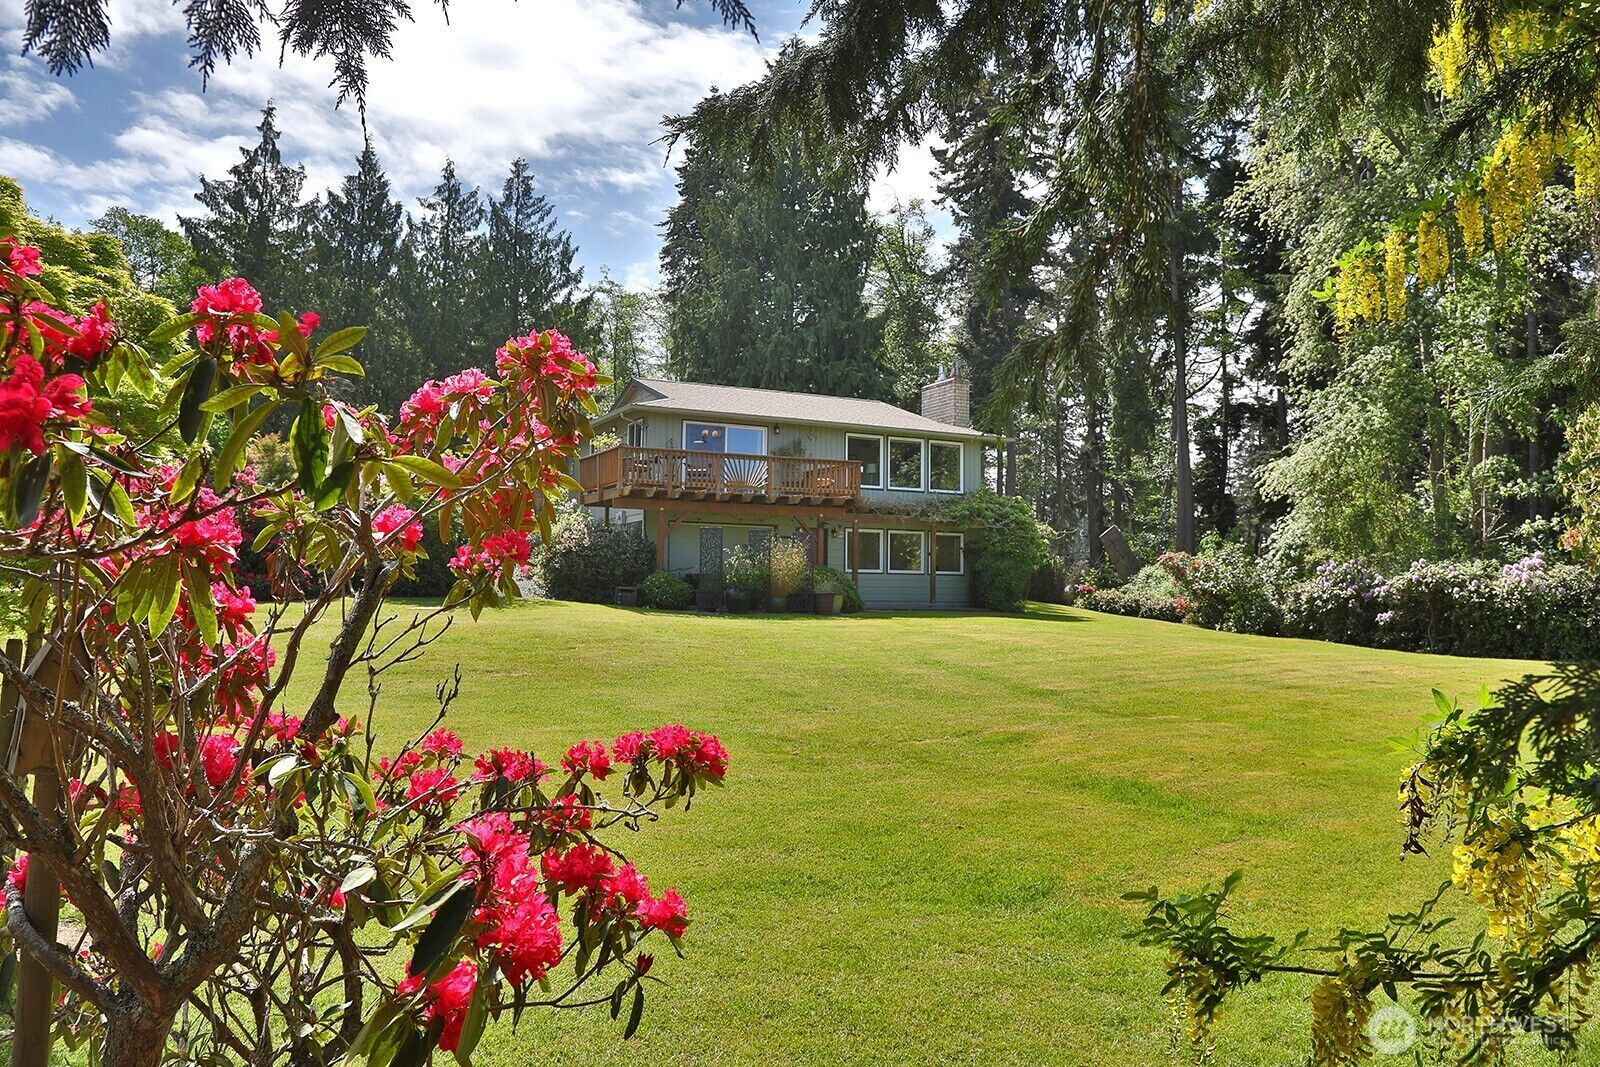
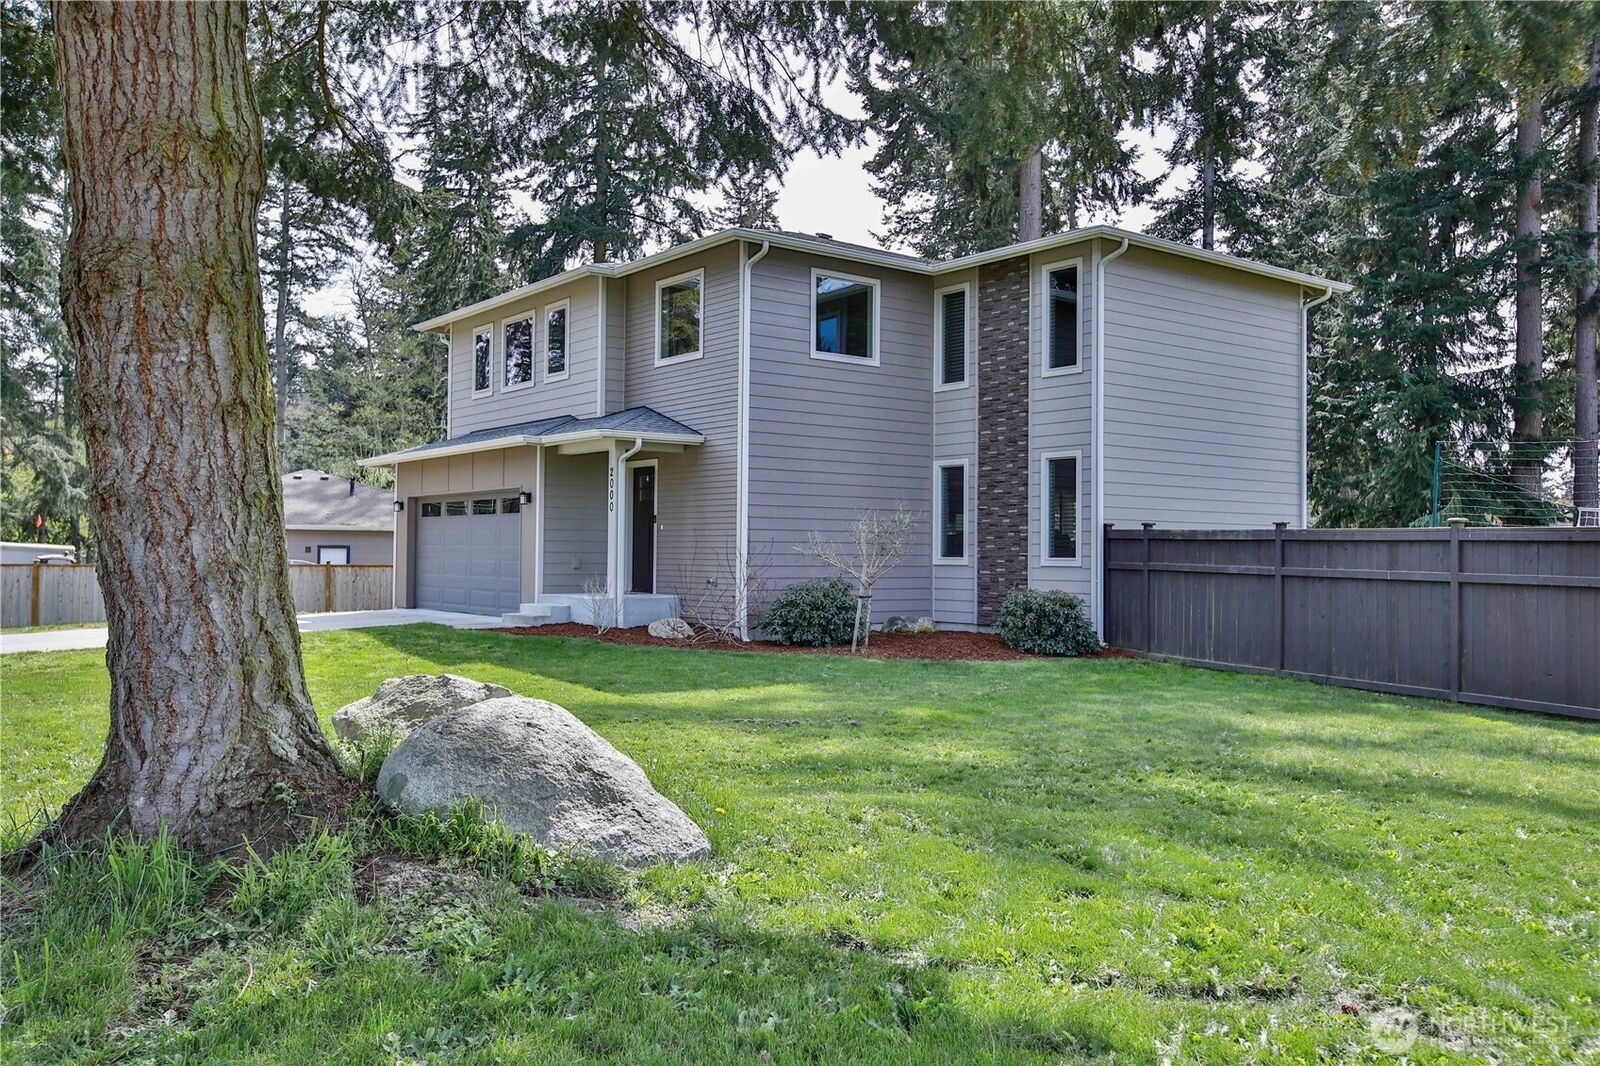
With Sound and Cascade views, flexible living space, and proximity to the ferry and Langley, this is the kind of lifestyle-specific South Whidbey home that may appeal strongly to the right buyer.
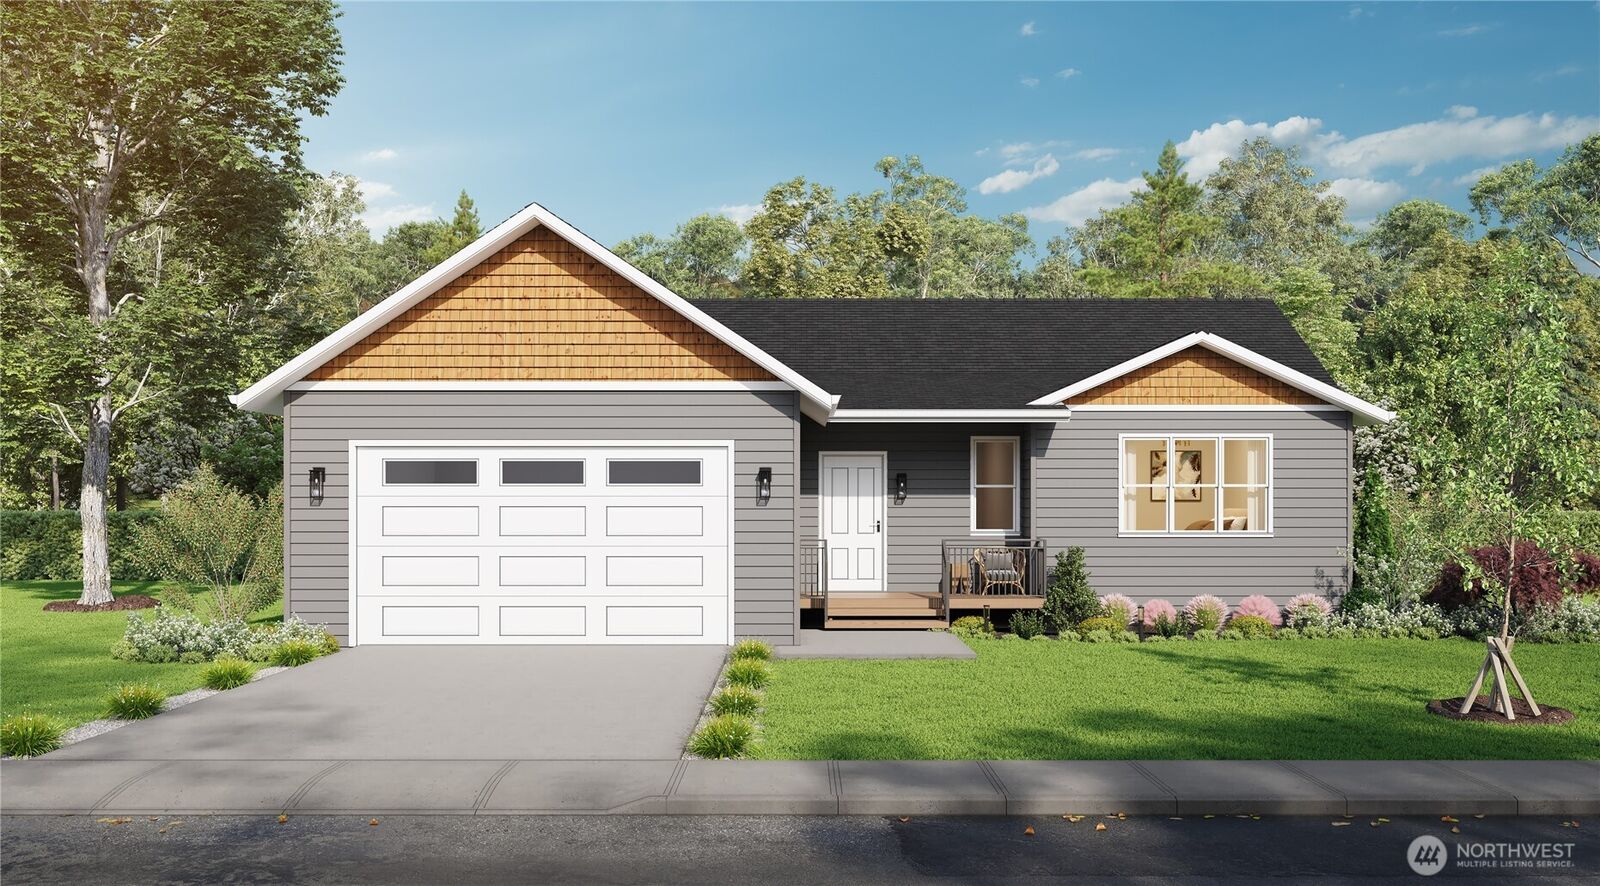
Land is its own market. Septic, utilities, neighborhood amenities, buildability, and buyer timeline all shape demand differently than a move-in ready home.
Listing details and availability can change quickly. These examples were drawn from the Windermere Whidbey active listings page and should be confirmed before making decisions.
What This Means If You Are Thinking About Selling
If you are considering selling this spring or early summer, the good news is that buyer activity is present. The better news is that buyers are responding to homes that feel well-prepared, well-priced, and easy to understand.
That does not mean every property should be priced aggressively. In a more balanced market, buyers compare options carefully. Presentation, condition, photography, pricing strategy, and launch timing all matter.
The strongest seller position is usually created before the home goes live: understanding nearby competition, identifying the likely buyer pool, preparing the property for that buyer, and pricing with enough discipline to generate early interest.
What This Means If You Are Thinking About Buying
For buyers, the spring market is offering more options than the winter market did. That is helpful, especially if you have been waiting for more variety in location, lifestyle, acreage, view, or price point.
Still, more options do not mean every good listing will sit. If a home is move-in ready, well-located, and priced in a competitive segment, it may still require a clear plan and a timely offer.
The best buyer strategy is to know your segment before you write. A buyer looking at North Whidbey homes near the median price is not in the same market as a buyer comparing South Whidbey luxury estates, Central Whidbey acreage, or vacant land.
A local market conversation can help translate broad Whidbey Island trends into the specific context around one property or search.
The Bottom Line
Whidbey Island’s spring 2026 market is active, but it is not uniform. Inventory is up, demand is present, and the market is slightly seller-leaning in the right pockets. At the same time, buyers have more choices than they did earlier in the year, and sellers still need to be thoughtful about pricing and preparation.
If you are trying to understand what this means for your home, your search, or your next move, the most important question is not just “What is the Whidbey market doing?” It is “What is happening in my specific micro-market right now?”
Talk With A Local Expert
Windermere Whidbey brokers work in these micro-markets every day. If you are thinking about selling, buying, or simply trying to understand the value and timing around a specific property, a local conversation can help you separate the broad trend from the details that matter most.
FAQ
Is Whidbey Island in a seller’s market right now?
Based on April 2026 closed-sales months of inventory, South Whidbey, Coupeville-Greenbank, and North Whidbey all showed seller-leaning conditions. But the market feels more balanced than overheated, and results vary by price range, condition, location, and property type.
Are more homes coming on the market this spring?
Yes. April inventory rose month over month across all three Whidbey submarkets reviewed: South Whidbey, Coupeville-Greenbank, and North Whidbey.
Does more inventory mean buyers have more negotiating power?
Sometimes, but not always. Buyers have more choices than they did earlier in the year, but buyer activity has also increased. Well-prepared homes in desirable segments may still attract strong attention.
Why do local price segments matter so much?
Whidbey Island includes many different property types, from move-in ready homes and view properties to acreage, luxury estates, condos, and land. Each segment can move at a different pace, so broad market averages should not be applied too casually to one specific property.
For many people considering life on Whidbey Island, health care is one of the biggest practical questions: What can you handle locally, what requires a trip off island, and how should that factor into where you choose to live?
Whidbey Island has more local health care infrastructure than many people expect. The island is served by WhidbeyHealth, a community-owned public hospital district, along with primary care, walk-in care, emergency medical services, rehabilitation, pharmacies, dental and vision practices, mental health providers, and additional options for eligible military families through Naval Health Clinic Oak Harbor.
At the same time, Whidbey is still an island community. Some specialty care, advanced procedures, complex diagnostics, pediatric subspecialties, high-risk maternity needs, major trauma, and academic medical care may require travel to Anacortes, Mount Vernon, Everett, Seattle, Bellingham, or another regional care center.
This guide is designed to give residents, retirees, families, and future Whidbey buyers a realistic overview of health care on Whidbey Island: what is available locally, where limitations can show up, and how to think about off-island care without letting it become a surprise later.
Important note: This guide is for general local-planning information only and is not medical advice. Health care services, hours, provider availability, insurance participation, referral requirements, and new-patient status can change. Always confirm details directly with the provider or health system. If you are experiencing a medical emergency, call 911. Editorial images in this guide are visual representations, not documentary photos of specific providers, patients, facilities, or listings.
Key Takeaways
WhidbeyHealth is the island’s main healthcare hub, with WhidbeyHealth Medical Center in Coupeville, 24/7 emergency care, EMS, primary care, walk-in care, and more than 20 service areas.
Emergency care is available on island, and WhidbeyHealth’s Emergency Department is listed by WhidbeyHealth as a Level 4 Trauma Center, Level 2 Cardiac Center, and Level 3 Stroke Center.
Everyday care is realistic locally, including primary care, walk-in care, labs, imaging, pharmacy access, rehabilitation, dental, vision, and many routine health needs.
Specialist access requires more planning. Some specialties are available locally or nearby, but advanced cardiology, neurology, oncology, pediatric subspecialties, high-risk maternity care, major trauma, and academic specialty care may require off-island trips.
Where you live on Whidbey matters. North Whidbey has easier driving access toward Anacortes and Mount Vernon, Central Whidbey is closest to WhidbeyHealth Medical Center, and South Whidbey often factors in ferry access to Mukilteo, Everett, and Seattle.
WhidbeyHealth: The Island’s Main Health Care Hub
WhidbeyHealth Medical Center in Coupeville is the center of hospital-based care on the island. WhidbeyHealth describes the medical center as a fully licensed, DNV-Certified Critical Access Hospital and Whidbey Island’s hub for comprehensive health care.
WhidbeyHealth is operated by the Whidbey Island Public Hospital District, a community-owned health system governed by publicly elected commissioners. That local structure matters because the system exists specifically to provide healthcare access for Whidbey Island residents and visitors.
For many routine, urgent, diagnostic, and emergency needs, the first local healthcare conversation starts with WhidbeyHealth or a local primary care provider. For more complex care, WhidbeyHealth and local providers may help coordinate referrals or transfers to larger regional systems.
Emergency Care on Whidbey Island
For emergencies, the simplest rule is the most important one: call 911. Do not try to use a guide like this to decide whether symptoms are serious enough. Chest pain, difficulty breathing, signs of stroke, severe bleeding, serious trauma, loss of consciousness, sudden loss of vision, and other urgent symptoms should be treated as emergencies.
WhidbeyHealth Emergency Care is staffed 24 hours a day. WhidbeyHealth lists its Emergency Department as certified by the Washington State Department of Health as a:
Level 4 Trauma Center
Level 2 Cardiac Center
Level 3 Stroke Center
WhidbeyHealth also notes that its Emergency Department can care for most emergency patients locally, while a smaller percentage require transfer off island for specialized treatment. That is an important distinction: Whidbey has a real emergency safety net, but major trauma, advanced cardiac care, advanced neurologic care, or highly specialized treatment may still require transfer to a larger regional center.
Emergency Medical Services Across the Island
WhidbeyHealth EMS serves the island with emergency response and interfacility transport. For residents, that means emergency planning is not just about the hospital building in Coupeville. It is also about how quickly responders can reach you, what roads connect your home to care, and whether a transfer may be needed for more specialized treatment.
This is especially relevant for people comparing North, Central, and South Whidbey. A beautiful rural setting can be a wonderful place to live, but it is worth thinking honestly about driveway access, winter weather, distance to services, cell reception, and how you would handle urgent care needs.
Everyday Care: Primary Care, Walk-In Clinics, and Routine Health Needs
For day-to-day healthcare, Whidbey residents typically think in terms of primary care, walk-in care, pharmacy access, routine labs, imaging, dental, vision, mental health, and rehabilitation services. Most of these categories are represented on island, but availability can vary by provider, location, insurance, and new-patient capacity.
Primary Care
WhidbeyHealth Primary Care provides routine care such as annual checkups, sick visits, chronic illness management, diabetes management, minor injuries, minor surgical procedures, physicals, and lab work. Primary care is also one of the most important referral pathways when specialty care is needed.
North Whidbey residents may also look at options such as North Island Medical in Oak Harbor, which describes itself as a primary and immediate care practice for the north end of Whidbey Island.
Walk-In and Immediate Care
WhidbeyHealth Walk-In Care lists locations in Clinton, Coupeville, and Oak Harbor. Walk-in care is generally for non-emergency issues such as cold and flu symptoms, minor cuts, sprains, mild asthma, ear or sinus pain, rashes, minor burns, urinary symptoms, and other concerns that need attention but are not life-threatening.
The key is matching the problem to the right level of care. Walk-in care can be appropriate for many minor illnesses and injuries. Emergency care is for symptoms that may be critical, life-threatening, or unable to wait.
Pediatrics and Family Care
Families should verify current pediatric availability directly with local providers. Pediatric Associates of Whidbey Island serves families from Oak Harbor and Freeland, some family medicine practices can care for children, and eligible military families may have access to pediatrics through Naval Health Clinic Oak Harbor. For pediatric subspecialties, complex pediatric conditions, or advanced children’s care, families may need regional options such as Seattle Children’s.
Dental, Vision, Pharmacy, and Rehabilitation
Whidbey has local dental offices, optometry/vision options, pharmacies, physical therapy, rehabilitation resources, and wellness providers across different parts of the island. These are often easy to overlook during a home search, but they matter for daily life — especially for retirees, families with children, and people managing ongoing health needs.
For buyers, this is a practical checklist item: before choosing a home, look at drive times not only to the hospital, but also to your pharmacy, dentist, eye doctor, physical therapist, grocery store, and the ferry or bridge route you would use for off-island appointments.
Local Planning Tip
If you are moving to Whidbey with ongoing prescriptions, regular specialist appointments, mobility concerns, or a chronic condition, set up care before the move whenever possible. Ask providers about new-patient availability, referral timing, pharmacy transfers, telehealth options, and what happens if you need urgent or after-hours care.
Specialists on Whidbey Island: What To Expect
Specialist access is where expectations matter most. WhidbeyHealth says providers represent more than 25 medical specialties available on Whidbey Island, and local systems provide many services close to home. But that does not mean every specialty, procedure, or subspecialty is available locally at all times.
In practical terms, Whidbey residents may be able to handle many routine or moderate needs on island, while more specialized or complex care may require travel. Availability can depend on staffing, referrals, appointment wait times, insurance, and whether a specialist is physically on island or coordinating care through a larger system.
Care More Likely To Be Available Locally or Nearby
Primary care and family medicine
Walk-in / immediate care
Emergency medicine
Basic lab work and diagnostic imaging
Chronic condition management through primary care
Diabetes management and wellness support
Physical therapy, occupational therapy, rehabilitation, and recovery support
Some orthopedic, women’s health, behavioral health, and specialty services depending on provider availability
Dental, vision, pharmacy, and other routine community healthcare services
Care That May Require Off-Island Travel
Some needs are more likely to involve Anacortes, Mount Vernon, Everett, Seattle, Bellingham, or another regional provider. These may include:
Advanced cardiology or interventional cardiology
Neurology, neurosurgery, or advanced stroke follow-up
Complex oncology, radiation oncology, or highly specialized cancer care
High-risk maternity care, maternal-fetal medicine, or NICU-level care
Pediatric subspecialists
Advanced orthopedic surgery, spine care, or complex joint cases
Advanced gastroenterology procedures or subspecialty care
Rheumatology, endocrinology, dermatology, allergy/immunology, ENT, or other specialties depending on current availability
Major trauma or complex emergency transfers beyond local hospital designation
Academic medical care, clinical trials, or highly specialized tertiary/quaternary care
The realistic takeaway is not that Whidbey lacks care. It is that island living works best when you know which needs can be handled locally and which ones may require a regional plan.
Nearest Off-Island Health Care Options To Know
Off-island care depends heavily on where you live on Whidbey. A North Whidbey resident may naturally look toward Anacortes, Mount Vernon, or Bellingham. A South Whidbey resident may think first about the Clinton ferry, Mukilteo, Everett, and Seattle. Central Whidbey residents often balance both directions while also being closest to WhidbeyHealth Medical Center in Coupeville.
Anacortes: Island Health
Island Health in Anacortes is one of the most relevant nearby off-island systems for many Whidbey residents, especially those on North and Central Whidbey. Island Health describes itself as a public hospital district serving Skagit, Island, and San Juan counties, with primary care and a broad range of specialty services.
Island Health’s site lists specialty and therapy areas such as cardiology, gastroenterology, nephrology, obstetrics and gynecology, orthopedics, psychiatry and behavioral health, pulmonology, sports and spine, surgery, urogynecology, urology, wound care, cardiac rehabilitation, diabetes education, physical therapy, occupational therapy, pulmonary rehabilitation, respiratory therapy, and speech therapy.
Mount Vernon and the Skagit Valley
Mount Vernon and the Skagit Valley can be practical for North Whidbey and some Central Whidbey residents, especially for appointments that are easier to reach by driving north through Deception Pass rather than taking a ferry. Before relying on any specific provider or specialty, confirm referral requirements, insurance participation, and appointment availability directly.
Everett: Providence Regional Medical Center Everett
For South Whidbey, Providence Regional Medical Center Everett is often a realistic regional hospital option after crossing the Clinton–Mukilteo ferry. Providence describes the Everett campus as a major medical center with a Level II Trauma Center.
For people who live near Clinton, Langley, Bayview, or Freeland, the ferry route to Mukilteo and Everett can be a major factor in how they think about specialist appointments, hospital access, and family support.
Seattle: UW Medicine, Seattle Children’s, and Other Major Specialty Centers
When advanced specialty care is needed, Seattle may come into the picture. UW Medical Center is an academic medical center with multidisciplinary specialty care. Seattle Children’s is a major pediatric specialty destination for children with complex needs.
Seattle access can be excellent medically, but it is rarely effortless logistically. Whidbey residents should account for ferry lines, ferry schedules, mainland traffic, parking, appointment timing, and whether a family member or caregiver can help with transportation.
Bellingham: PeaceHealth St. Joseph Medical Center
PeaceHealth St. Joseph Medical Center in Bellingham may be another regional option depending on insurance, referrals, specialty needs, and where you live on the island. For some North Whidbey residents, Bellingham can be part of the broader care map.
North, Central, and South Whidbey: How Location Changes the Health Care Picture
Health care access on Whidbey is not one-size-fits-all. The island is long, and your experience can feel different depending on where you live.
North Whidbey
Oak Harbor and North Whidbey residents have local options such as WhidbeyHealth services, North Island Medical, pharmacies, private practices, and Naval Health Clinic Oak Harbor for eligible military/TRICARE patients. North Whidbey also has the practical advantage of bridge access toward Anacortes, Mount Vernon, and Bellingham.
Central Whidbey
Central Whidbey is closest to WhidbeyHealth Medical Center in Coupeville, which can be an important consideration for people who want to be near the island’s hospital hub. Coupeville also offers small-town living with relatively central access north and south.
South Whidbey
South Whidbey residents often balance local care with ferry access. Clinton, Langley, Freeland, and Bayview can be convenient for island lifestyle, and the Clinton ferry can make Everett and Seattle specialist appointments realistic — but ferry timing becomes part of the plan.
What Buyers and Future Residents Should Ask Before Choosing a Home
If health care access is part of your Whidbey decision, think beyond the nearest hospital. The better question is: how will this location support your real life?
How far is the home from WhidbeyHealth Medical Center in Coupeville?
Where is the nearest walk-in clinic or primary care option?
Which pharmacy would you use?
Do you need frequent specialist appointments off island?
Would you usually drive north through Deception Pass or use the Clinton ferry?
How comfortable are you with winter driving, ferry delays, or longer appointment days?
If you had surgery or a medical event, who could help with transportation and recovery?
Does the home support aging in place, mobility needs, or future caregiving?
Is the driveway, entry, bedroom layout, and bathroom setup practical long term?
These questions do not mean you need to live next door to a hospital. They simply help you choose a home and location with eyes open.
Helpful Local Health Care Directory Links
The providers below are not endorsements or a complete list. Think of them as a practical starting point for checking everyday care categories that matter when you are comparing Whidbey neighborhoods. Always confirm services, hours, insurance, referrals, and new-patient availability directly.
WhidbeyHealth Rehabilitation Care is relevant for physical therapy, occupational therapy, speech therapy, recovery support, and referrals after injury, surgery, or illness.
Dental availability is local but practice-specific. One example to check is Whidbey Dental Associates in Oak Harbor; buyers should also compare dentists near their likely daily errands.
Behavioral Health and Community Support
Island County Behavioral Health is a helpful public resource for local mental-health information, and private counseling clinics may also be available in Oak Harbor, Freeland, and nearby communities.
For people moving to Whidbey, this directory-style check can be just as important as looking at hospital distance. A home may feel very different day to day depending on whether your regular care is five minutes away, 25 minutes away, or tied to a ferry schedule.
Thinking About Moving to Whidbey With Health Care Access in Mind?
A local Windermere Whidbey agent can help you compare neighborhoods, ferry routes, drive times, daily services, and home layouts so your next move fits both your lifestyle and your practical needs.
Homes That Show How Location and Lifestyle Fit Together
Every buyer’s healthcare priorities are different. Some want to be close to Coupeville and the island’s hospital hub. Others prefer South Whidbey’s ferry access toward Everett and Seattle. Some prioritize single-level living, newer systems, or a lower-maintenance footprint. The examples below are active residential-style listings that show how different Whidbey locations can support different next-step needs.
Example Fit: Central Whidbey Access in Coupeville
2000 Virginia Avenue, Coupeville is an active residential listing in Central Whidbey. For buyers who want to be near Coupeville and the island’s main hospital hub, this type of location can be especially practical.
1041 Halsey Drive, Coupeville is an active 2-bedroom, 2-bath residential listing with approximately 1,500 square feet, views of Admiralty Inlet and the Olympic Mountains, and Admirals Cove amenities. It shows how a smaller home can still offer a strong Whidbey lifestyle while keeping Central Whidbey services within reach.
Example Fit: Single-Level Living Near Freeland Services
1806 Twin Oaks Lane, Freeland is an active 3-bedroom, 2-bath residential listing with approximately 1,695 square feet, new construction, and a single-level layout. For buyers thinking about long-term livability, fewer stairs and proximity to everyday services can matter as much as square footage.
Example Fit: South Whidbey Space With Main-Floor Comfort
5427 Bayview Road, Langley is an active 3-bedroom, 4-bath residential listing with a main-level primary suite, flexible guest spaces, and a location near Bayview, Langley, Freeland, and the Clinton ferry. For some households, the right fit is not smaller — it is a layout that supports guests, caregiving, hobbies, and comfortable daily living.
Yes. WhidbeyHealth Medical Center in Coupeville is the island’s main hospital hub. WhidbeyHealth describes it as a fully licensed, DNV-Certified Critical Access Hospital and part of the Whidbey Island Public Hospital District.
Is there emergency care on Whidbey Island?
Yes. WhidbeyHealth’s Emergency Department is staffed 24 hours a day, and WhidbeyHealth EMS serves the island. For emergencies, call 911. Some serious or highly specialized emergencies may require off-island transfer.
Can Whidbey residents get primary care on island?
Yes. WhidbeyHealth Primary Care and other local practices provide primary care options, though new-patient availability, accepted insurance, and appointment timing should always be confirmed directly.
Are specialists available on Whidbey Island?
Some specialty services are available locally or through nearby systems, but not every specialty or advanced procedure is available on island. Complex or highly specialized care may require travel to Anacortes, Mount Vernon, Everett, Seattle, Bellingham, or another regional center.
What off-island hospitals do Whidbey residents commonly consider?
Depending on location, insurance, referral needs, and urgency, residents may look toward Island Health in Anacortes, providers in Mount Vernon or the Skagit Valley, Providence Regional Medical Center Everett, UW Medicine in Seattle, Seattle Children’s for pediatric specialty care, or PeaceHealth St. Joseph Medical Center in Bellingham.
Should health care access affect where I buy a home on Whidbey?
It can. Buyers with frequent appointments, chronic health needs, mobility concerns, or aging-in-place priorities should consider drive times to WhidbeyHealth, walk-in care, pharmacies, ferry routes, bridge access, and off-island specialists when comparing homes and neighborhoods.
What everyday health care providers should I check before moving to Whidbey?
In addition to hospitals and primary care, check pediatric availability, eye care, dental care, rehabilitation or physical therapy, pharmacy access, behavioral health resources, and any recurring specialist needs. Confirm new-patient status, insurance participation, referral requirements, and likely drive times before choosing a location.
Find a Whidbey Home That Fits the Way You Actually Live
Health care access is one part of a bigger quality-of-life picture: ferry routes, daily errands, home layout, services, community, and long-term comfort all matter.
For many Whidbey Island homeowners, the question is not simply “Should I sell?” It is “Does this home still fit the life I want now, and the life I may need a few years from now?”
That question can come up quietly. Maybe the stairs feel a little steeper than they used to. Maybe the yard takes more time than it gives back. Maybe family is farther away, healthcare appointments are becoming more frequent, or the house that once felt perfectly sized now feels like more space than you want to manage.
It can also come from the opposite direction. You may love your neighborhood, your garden, your view, your community, and your routines. On Whidbey Island, those roots matter. Staying may be the right answer. Selling may be the right answer. Sometimes the best first step is not making a decision immediately, but getting a clearer picture of what each path would actually require.
Image and listing note: The editorial lifestyle images in this guide are visual representations of next-chapter living on Whidbey Island, not documentary photos of specific homeowners or homes. Active listings change quickly. The homes featured below were selected as examples of residential-style options that may fit different next-chapter needs, such as main-floor living, lower-maintenance layouts, flexible guest space, or move-in-ready comfort. Always confirm current status, pricing, availability, and property details with a Windermere Whidbey agent.
Key Takeaways
Staying can work beautifully when the home can be made safer, simpler, and more manageable over time.
Selling may make sense when maintenance, stairs, isolation, ferry logistics, or healthcare access are starting to create friction.
The best answer is personal, not generic. Whidbey homes vary widely: waterfront cabins, acreage properties, in-town homes, condos, manufactured homes, and low-maintenance new construction all solve different problems.
Before making a move, compare the real numbers. Look at current market value, likely selling costs, repair needs, buying power, monthly comfort, and lifestyle tradeoffs.
A local agent can help you pressure-test the decision before you commit to staying, remodeling, downsizing, or selling.
Start With the Real Question: What Do You Need Your Home To Do Next?
A home that worked perfectly ten or twenty years ago may not match your next chapter in the same way. That does not mean anything is wrong with the home. It simply means your life may be asking different things from it now.
For Whidbey Island homeowners, this often comes down to a few practical questions:
Can you live comfortably on one level if stairs become harder?
Is the yard, acreage, driveway, or waterfront maintenance still enjoyable?
Are you close enough to healthcare, groceries, ferry access, friends, and family?
Would a guest suite, detached studio, or flexible room help family visit or provide support?
Would selling free up equity, reduce stress, or open the door to a simpler lifestyle?
If you stay, what improvements would make the home safer and easier to live in?
The goal is not to talk yourself into moving. It is to be honest about whether your home is still supporting your life, or quietly asking more from you than you want to give.
Not Sure Whether Staying or Selling Makes More Sense?
You do not have to figure it out alone. A local Windermere Whidbey agent can help you compare your current home, your likely market value, your next-step options, and what a realistic move would look like on Whidbey Island.
Staying can be a strong choice when your home still fits your daily life, your support network is nearby, and the property can adapt without becoming a burden. For many island homeowners, the emotional value of staying is real: familiar neighbors, established gardens, known ferry rhythms, favorite walking routes, and the comfort of a place that already feels like home.
Staying may make sense if:
You have a bedroom, bathroom, laundry, kitchen, and main living area on one level.
Your home can be modified with safer entries, better lighting, grab bars, improved flooring, or easier shower access.
You have reliable help for maintenance, yard work, firewood, storm cleanup, or repairs.
Your location still supports your healthcare, shopping, ferry, and social needs.
You have enough financial flexibility to make the home safer without over-improving for the neighborhood.
On Whidbey, this decision also depends heavily on micro-location. A home outside town with acreage may be peaceful and private, but it may also mean more driving, more outdoor maintenance, and more responsibility during winter weather. A home near Langley, Coupeville, Freeland, or Oak Harbor may offer easier daily access, but less privacy or space. Neither is automatically better. The question is what will serve your next chapter best.
When Selling May Be the Better Path
Selling may be worth exploring when the home is starting to create stress, expense, or limitations that are unlikely to improve. This is especially true if you are already avoiding parts of the home, delaying repairs, worrying about stairs, or feeling tied to maintenance you no longer enjoy.
Signs it may be time to look at options include:
The home has more stairs, square footage, rooms, or land than you realistically want to manage.
Deferred maintenance is building up faster than you can comfortably address it.
You need to be closer to family, medical care, the ferry, shopping, or community activities.
Your current layout does not support aging in place without major renovations.
You would rather use your equity for retirement flexibility, travel, family support, or a simpler home.
You want to move while the decision is still proactive, not forced by a health event or urgent repair.
One of the most helpful things a homeowner can do is run the numbers before the decision becomes urgent. A local pricing conversation can show what your home may be worth today, what improvements might matter before listing, and what kinds of replacement homes are realistically available in your desired price range.
Think in Terms of Fit, Not Just Size
Downsizing is not always about moving into the smallest possible home. For many Whidbey homeowners, the better word is right-sizing: choosing a home that fits the way you actually want to live now.
That might mean:
a single-level home near Freeland shops and services
a smaller view home with less yard maintenance
a condo or townhome-style property with exterior maintenance handled differently
a home with guest space for family visits or caregiving support
a move-in-ready home that does not require a long renovation list
a more central location that shortens daily drives
For some homeowners, the ideal next home is not dramatically smaller. It is simply easier: fewer stairs, newer systems, better layout, less upkeep, more convenient location, or more flexible living space.
Example Next-Chapter Fit: Single-Level New Construction in Freeland
1806 Twin Oaks Lane, Freeland is an active 3-bedroom, 2-bath residential listing with approximately 1,695 square feet, a single-level layout, new construction, and a location near Freeland amenities.
For buyers thinking about easier living, this type of home can be appealing because it combines a fresh build, one-level design, and central South Whidbey convenience without moving off island.
Sometimes the right answer is not selling. It is modifying the home you already own. Before assuming you need to move, consider what targeted changes could make your current home safer, more comfortable, and easier to maintain.
Possible updates include:
adding or improving main-level sleeping space
replacing a tub with a more accessible shower
improving exterior lighting and entry paths
adding handrails, grab bars, or safer flooring
reducing high-maintenance landscaping
updating heating, cooling, or windows for year-round comfort
creating better guest or caregiver space
The key is comparing renovation cost against long-term fit. A $20,000 improvement that helps you comfortably stay for ten years may be a great investment. A much larger remodel on a home that still has major location, stair, or maintenance drawbacks may be less practical.
Whidbey-Specific Factors To Weigh
Whidbey Island adds a few local layers to the stay-or-sell decision. A home that looks perfect on paper may feel different depending on ferry access, winter driving, proximity to services, or how much land and shoreline care it requires.
Ferry and Driving Patterns
If you rely on the Clinton ferry, make regular mainland medical appointments, or have family visiting from off island, location matters. A beautiful private setting may still be worth it, but the travel pattern should feel realistic, not exhausting.
Healthcare and Daily Services
Being closer to Coupeville, Freeland, Oak Harbor, or local clinics may become more important over time. Even small reductions in driving can make daily life easier.
Maintenance and Weather
Island homes can face salt air, wind, trees, drainage issues, septic systems, wells, bluff considerations, and storm cleanup. If maintenance is starting to feel like a second job, that matters.
Community and Belonging
Do not underestimate the value of neighbors, routines, favorite businesses, faith communities, clubs, beaches, trails, and familiar town rhythms. The right real estate decision should support your life, not just your square footage.
Example Next-Chapter Fit: Views, Amenities, and Move-In-Ready Comfort
1041 Halsey Drive, Coupeville is an active 2-bedroom, 2-bath residential listing with approximately 1,500 square feet, views of Admiralty Inlet and the Olympic Mountains, and community amenities in Admirals Cove.
For someone who wants a more manageable footprint without giving up the feeling of Whidbey scenery, this type of home shows how “smaller” can still feel special.
Many long-time Whidbey homeowners have built meaningful equity. That equity can create choices, but only if you understand what it can realistically do for you.
A market review can help you estimate:
your likely sale price range
repairs or updates that may affect buyer response
estimated selling costs
how much cash may be available after a sale
what you could buy locally or elsewhere
whether a purchase before sale, sale before purchase, or contingent move is realistic
This is where local expertise matters. Whidbey values can shift sharply based on town, view, waterfront, acreage, condition, ferry proximity, and lifestyle appeal. A generic online estimate may miss the details that actually drive buyer interest here.
Questions To Ask Before You Decide
If you are trying to decide whether to stay or sell, these questions can help clarify the next step:
What parts of my home do I still love?
What parts of my home do I avoid, worry about, or postpone dealing with?
If I stayed five more years, what would need to change?
If I sold, where would I realistically go?
Would I want to stay on Whidbey, move closer to family, or split time between places?
How much maintenance do I want in this next season of life?
Do I need guest space, caregiver flexibility, rental potential, or a lock-and-leave setup?
Would moving now give me more control than waiting until I have to move?
Example Next-Chapter Fit: Main-Floor Living With Room for Guests
5427 Bayview Road, Langley is an active 3-bedroom, 4-bath residential listing with approximately 5,056 square feet, a main-level primary suite, flexible guest spaces, and a central South Whidbey location near Bayview, Langley, Freeland, and the Clinton ferry.
This is not a downsizing example. It is a good reminder that some next-chapter buyers still want room for family, hobbies, hosting, or extended stays while prioritizing main-floor comfort and island convenience.
If selling becomes the right path, the goal is to make the process feel calm, organized, and strategic. That usually starts before the home is listed.
A good pre-listing plan may include:
a realistic pricing conversation based on local buyer demand
a walkthrough to identify high-impact repairs and low-return projects to skip
decluttering and staging guidance that respects the way you actually live
a plan for timing, photography, listing launch, and showing logistics
a discussion about where you will go next and how to coordinate the move
For longtime homeowners, this can feel emotional. A home may hold decades of holidays, family visits, garden seasons, pets, projects, and memories. The right agent should understand that selling is not just a transaction. It is a transition.
Example Next-Chapter Fit: Refreshed, Single-Level Island Living
1945 Beachwood Drive, Freeland is an active 3-bedroom, 2-bath listing with approximately 1,712 square feet, a single-level layout, refreshed finishes, and a peaceful evergreen setting near Freeland amenities and beaches.
For buyers looking for a full-time residence, weekend place, or simpler island setup, this type of home can offer comfort without the scale or upkeep of a larger estate property.
You do not have to make the stay-or-sell decision all at once. A thoughtful first step is simply to gather information:
What is your home likely worth in today’s Whidbey market?
What would it take to make the home work better if you stayed?
What homes are available that might fit your next chapter?
What timeline would give you the most control?
What would make the decision feel peaceful instead of rushed?
For some homeowners, that conversation confirms that staying is the right answer. For others, it opens a path toward a simpler, safer, or more flexible home. Either way, clarity is valuable.
Thinking About Your Next Chapter on Whidbey?
Whether you are considering aging in place, downsizing, moving closer to town, or simply understanding your options, Windermere Whidbey can help you make a local, practical, pressure-free plan.
How do I know if I should stay in my Whidbey Island home or sell?
Start by looking at daily fit, not just market conditions. If the home is safe, manageable, financially comfortable, and still supports your lifestyle, staying may make sense. If maintenance, stairs, location, healthcare access, or isolation are becoming concerns, it may be time to compare selling and right-sizing options.
Is downsizing the same as moving into a much smaller home?
No. Many Whidbey homeowners are better served by right-sizing, which means choosing a home that fits their next chapter. That may mean single-level living, less yard work, a newer home, a more convenient location, or flexible guest space rather than simply choosing the smallest property.
Should I renovate my current home before deciding to sell?
Sometimes, but not always. Small safety, comfort, and maintenance improvements may make staying realistic. Larger renovations should be weighed against your long-term needs, current market value, and what it would cost to buy a better-fitting home.
What Whidbey-specific issues should I consider before aging in place?
Consider ferry access, winter driving, proximity to healthcare and groceries, septic or well maintenance, storm cleanup, stairs, yard care, waterfront or bluff responsibilities, and whether your support network is close enough for the years ahead.
Can a local real estate agent help even if I am not ready to sell?
Yes. A good local agent can help you understand your home’s current market value, likely buyer expectations, possible preparation items, and what replacement homes may cost. That information can help you decide whether to stay, remodel, sell soon, or simply plan ahead.
May is when Whidbey Island stops hinting at spring and starts showing off. Gardens are blooming, farmers markets are settling into their rhythm, music calendars are filling up, and community events stretch from Oak Harbor and Coupeville to Greenbank, Freeland, Clinton, Bayview, and Langley.
This guide highlights some of the best Whidbey Island May 2026 events to know about, including festivals, markets, live music, art, garden events, Memorial Day gatherings, and a few thoughtful community programs worth putting on your calendar.
Image note: The images in this guide are editorial illustrations created to represent the feel of May events on Whidbey Island. They are not documentary photos of the specific events, people, venues, or businesses listed below.
Key Takeaways
Big May anchors: Penn Cove Water Festival, Whidbey Clay Weekend, Mother’s Day at Meerkerk Gardens, WICA’s anniversary programming, Whidbey Island Jazz Festival, and Memorial Day weekend in Coupeville.
Best towns to watch: Langley has a packed arts and music calendar, Coupeville brings strong festival and Memorial Day energy, and Oak Harbor adds plant sales, remembrance events, and late-month concerts.
Recurring favorites: Bayview Farmers Market, Coupeville Farmers Market, Dancing Fish live music, Meerkerk garden tours, and Bayview Hall community movement events help fill the month between major weekends.
Planning tip: Check event pages before heading out. Island events can change quickly, and some ticketed performances may sell out.
May Festivals, Markets, Gardens & Community Events
If you want May to feel like spring on Whidbey, start with the seasonal events: native prairie blooms, pottery and art markets, garden concerts, farmers markets, and community fundraisers. These are the events that make the island feel especially alive before summer fully arrives.
Celebrate native wildflowers, prairie restoration, native plant sales, guided walks, education talks, and citizen science in one of Central Whidbey’s most distinctive landscapes.
This three-day ceramics celebration includes a spring show, pottery market, artist talk, potter’s potluck, and Clay Olympics. It is one of May’s strongest art-and-maker events.
One of May’s signature events, the Penn Cove Water Festival celebrates Native American culture with canoe races, storytelling, food, crafts, demonstrations, performances, and family-friendly waterfront energy.
Gardeners can shop perennials, herbs, vegetable starts, houseplants, baskets, and colorful spring plantings while supporting a long-running Oak Harbor community group.
The second annual Golf Classic brings together businesses, friends, and community groups for a best-ball scramble supporting Greater Freeland Chamber programs.
This Clinton-area rescue fundraiser brings together local creatives, vendors, animal lovers, dinner, auction energy, and a cause many islanders care about.
Local Tip
May weekends can get surprisingly packed, especially when Coupeville, Langley, Meerkerk Gardens, and farmers markets all have events on the same day. If you are crossing the island, give yourself extra ferry and parking time, and consider turning one event into a half-day town visit instead of trying to rush between several stops.
Arts, Theater, Dance & Live Music in May
Langley carries much of the island’s performance calendar this month, especially through WICA, Ott & Hunter, OutCast Productions, and the Whidbey Island Jazz Festival. But the month also stretches into Freeland, Clinton, Greenbank, and Oak Harbor with dance, classical music, winery shows, and community concerts.
When: May 8–9, multiple performances Where:WICA, Langley
Whidbey Island Dance Theatre’s annual showcase features pre-professional dancers and guest artists performing ballet, lyrical, hip hop, jazz, tap, acro, and more.
Jim Carroll’s one-person show shares candid, emotionally honest, and occasionally humorous reflections on life as a firefighter, EMT, father, husband, and secular humanist.
Four days of jazz return to WICA with Christian McBride and Ursa Major, Whidbey Jazz Residency nights, Little Groovers for kids, the Brubeck Brothers Quartet, and local performers.
Saratoga Orchestra closes the month with a one-night concert featuring pianist Julian Garvue and works by Ravel, Mozart, and Stacy Garrop.
Workshops, Talks, Wellness & Community Learning
May is also full of quieter events that are easy to miss if you only scan the big festival weekends. Libraries, community halls, Healing Circles Langley, and local organizations are hosting programs on belonging, deathcare, caregiving, Medicare, digital balance, dance, civic readiness, and more.
May 7, program 6–8 p.m. at St. Hubert’s Community Room, Langley. A free civic conversation with Rep. Clyde Shavers on campaign finance and the Transparent Elections concept.
May 12, 6–7:30 p.m. online. Journalist and media educator T. Andrew Wahl shares practical ways to build a healthier relationship with your information diet.
May 20, 5:30–7 p.m. at South Whidbey Fire Station / Bayview. Local chambers, fire, sheriff, and police representatives discuss how the FIFA World Cup may affect Whidbey businesses and residents.
May 27, 5:30–7 p.m. at Bayview Community Hall. A free, no-experience-needed flamenco movement session with Amelia Moore of Oleaje Flamenco.
Farmers Markets, Winery Music & Recurring May Favorites
Not every May outing needs to be a major festival. Some of the best island weekends are built around a farmers market, a garden walk, a winery music night, or a casual community gathering.
Thursday music nights run May 7, 14, 21, and 28 from 5:30–7:30 p.m. at Dancing Fish Vineyards, with performers including Queen of Hearts, The Buffleheadz, MaSango, and The Dead Guise. Details: Dancing Fish events.
Meerkerk Garden Tours
Docent-led garden tours continue through the season at Meerkerk Gardens in Greenbank. Pair a tour with the Mother’s Day concert or a quieter weekday garden visit.
Prayerbody at Bayview Hall
Sundays in May, 10 a.m.–noon at Bayview Hall. This by-donation movement gathering includes live music. Details: prayerbody.com.
Memorial Day Weekend & Late-May Community Events
Late May brings a slightly different rhythm: Memorial Day remembrance, Coupeville’s parade, community fundraisers, jazz, and a few practical local events. It is a good weekend to slow down, make space for remembrance, and enjoy Whidbey’s small-town gathering places.
When: May 25; 10 a.m. Maple Leaf Cemetery, 1 p.m. Sunnyside Cemetery, 2 p.m. American Legion open house Where: Oak Harbor and Coupeville remembrance locations
Pacific Northwest Naval Air Museum and American Legion George Morris Post 129 co-host a respectful Memorial Day series of remembrance services.
Island Senior Resources hosts a benefit dinner and live auction supporting programs that help older adults across Whidbey Island.
Local life, not just local events
Finding Your Place on Whidbey
Event guides are one of the best ways to understand what life on Whidbey actually feels like. A month of markets, concerts, garden walks, library talks, Memorial Day gatherings, and small-town fundraisers says a lot about the rhythm of the island.
If you are exploring a move, comparing towns, or trying to understand which part of Whidbey fits your lifestyle, start with the places you are naturally drawn to. A Saturday in Coupeville feels different from a WICA night in Langley, a Greenbank garden visit, or a North Whidbey community event.
Frequently Asked Questions About Whidbey Island May Events
What are the biggest Whidbey Island events in May 2026?
Major May 2026 highlights include Penn Cove Water Festival, Whidbey Clay Weekend, Mother’s Day Concert at Meerkerk Gardens, WICA’s 30th anniversary programming, Whidbey Island Jazz Festival, Coupeville Memorial Day Parade, and several farmers markets and community fundraisers.
Are there family-friendly Whidbey Island events in May?
Yes. Good family-friendly options include Prairie Days, farmers markets, Penn Cove Water Festival, Mother’s Day at Meerkerk Gardens, Little Groovers at the Whidbey Island Jazz Festival, Coupeville Memorial Day Parade, and many library programs.
Which towns have the most May events on Whidbey Island?
Langley has the densest arts and music calendar, especially through WICA and local venues. Coupeville is strong for festivals, markets, and Memorial Day events. Greenbank, Freeland, Clinton, Bayview, and Oak Harbor all add meaningful community, garden, music, and fundraiser events throughout the month.
Should I buy tickets ahead of time for May events?
For WICA performances, Whidbey Island Jazz Festival events, winery concerts, benefit dinners, retreats, and some workshops, buying tickets or registering ahead is smart. Free festivals and markets are usually easier to attend casually, but it is still worth checking the event page before you go.
Where can I learn more about living near Whidbey Island events and town centers?