Facebook
 X
X
 Pinterest
 Copy Link


The following analysis of select counties of the Western Washington real estate market is provided by Windermere Real Estate Chief Economist Matthew Gardner. We hope that this information may assist you with making better-informed real estate decisions. For further information about the housing market in your area, please don’t hesitate to contact your Windermere Real Estate agent.
Click here to get the Printable PDF version of the report!
Regional Economic Overview
The most recent employment data (from May) showed that all but 2,800 of the jobs lost during the pandemic have been recovered. More than eight of the counties contained in this report show employment levels higher than they were before COVID-19 hit. The regional unemployment rate fell to 4.5% from 5.2% in March, with total unemployment back to pre-pandemic levels. For the time being, the local economy appears to be in pretty good shape. Though some are suggesting we are about to enter a recession, I am not seeing it in the numbers given rising employment and solid income growth.
Western Washington Home Sales
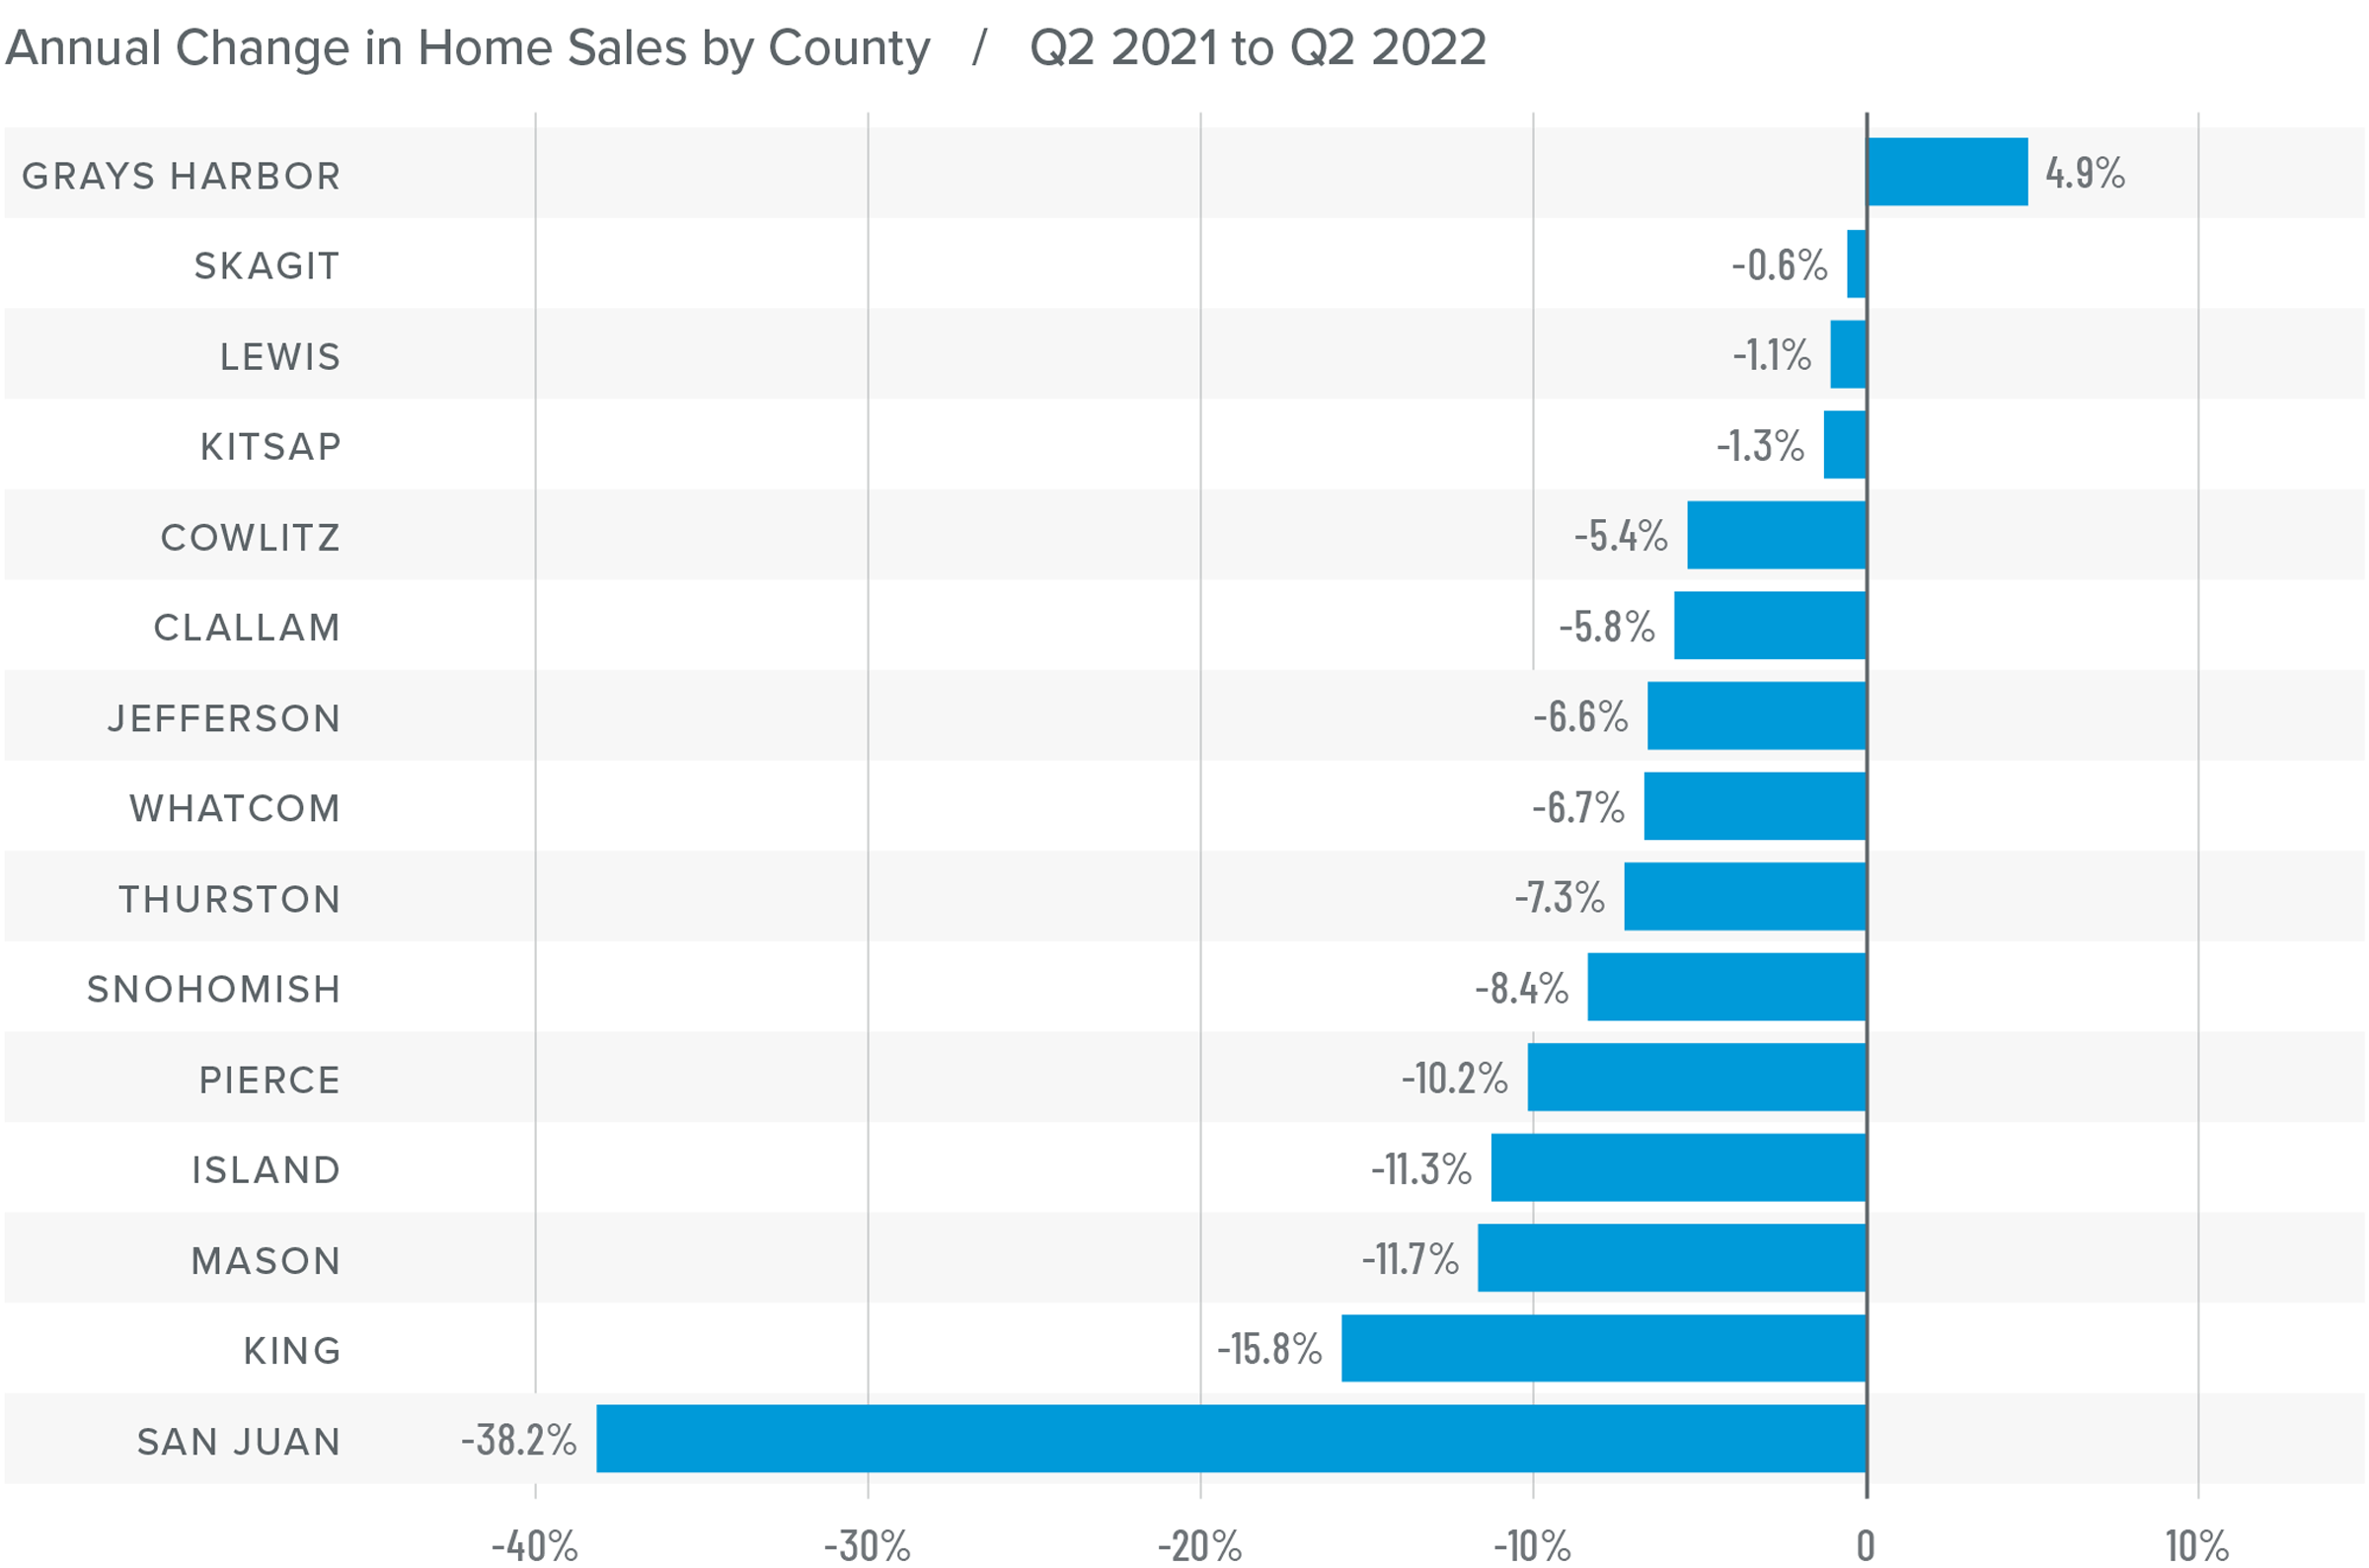
❱ In the second quarter of 2022, 23,005 homes sold, representing a drop of 11% from the same period a year ago, but up by a significant 52% from the first quarter of this year.
❱ Sales rose in Grays Harbor County compared to a year ago but fell across the balance of the region. The spring market, however, was very robust, likely due to growing inventory levels and buyers trying to get ahead of rising mortgage rates.
❱ Second quarter growth in listing activity was palpable: 175% more homes were listed than during the first quarter and 61.98% more than a year ago.
❱ Pending sales outpaced listings by a factor of 3:1. This is down from the prior year but only because of the additional supply that came to market.
Western Washington Home Prices
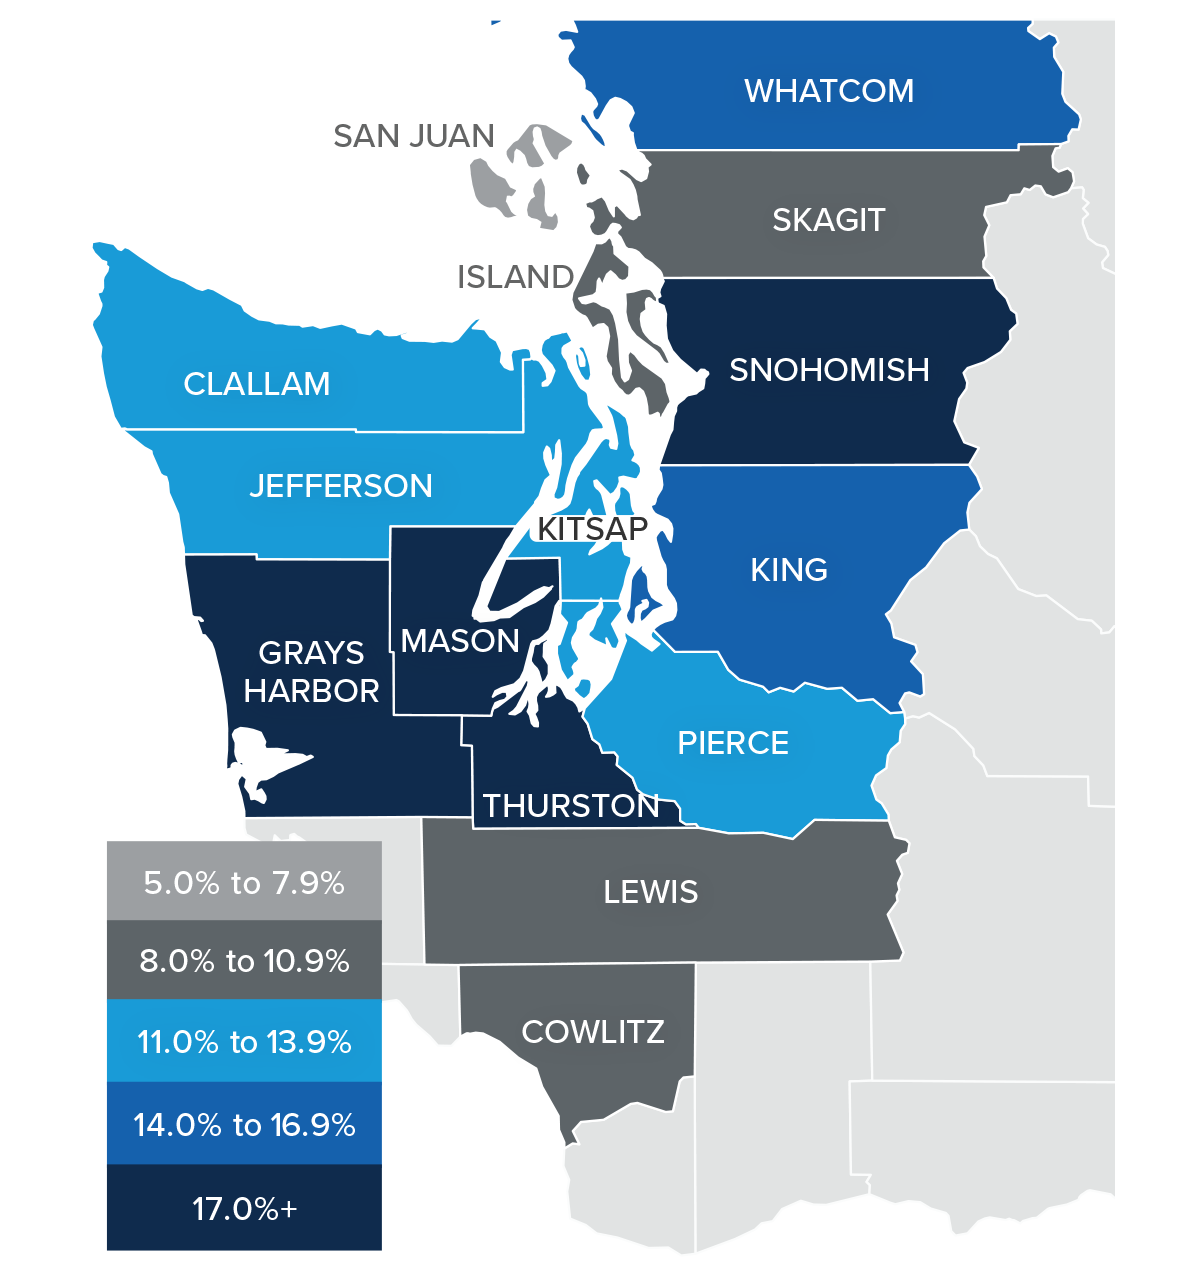
❱ Even in the face of rising mortgage rates, home prices continue to rise at a well-above-average pace, with average prices up 13.3% year over year to $830,941.
❱ I have been watching list prices as they are a leading indicator of the health of the housing market. Thus far, despite rising mortgage rates and inventory levels, sellers remain confident. This is reflected in rising median list prices in all but three counties compared to the previous quarter. They were lower in San Juan, Island, and Jefferson counties.
❱ Prices rose by double digits in all but four counties. Snohomish, Grays Harbor, Mason, and Thurston counties saw significant growth.
❱ List prices and supply are both trending higher, but this has yet to slow price growth significantly. I believe we will see the pace of appreciation start to slow, but not yet.

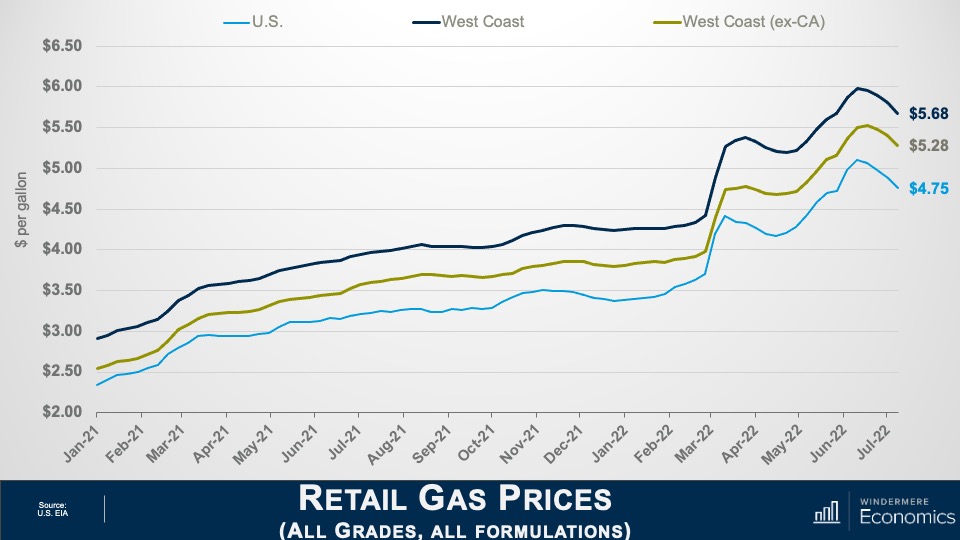
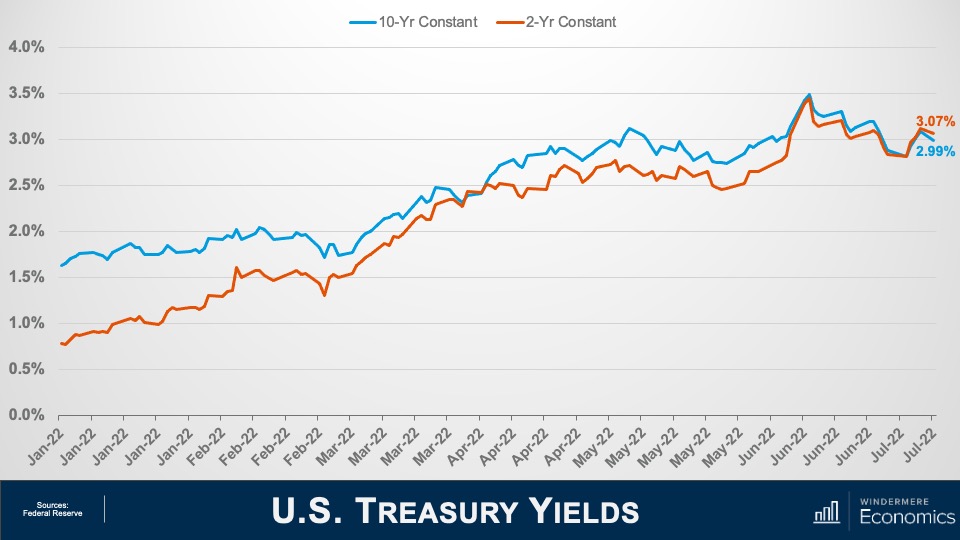
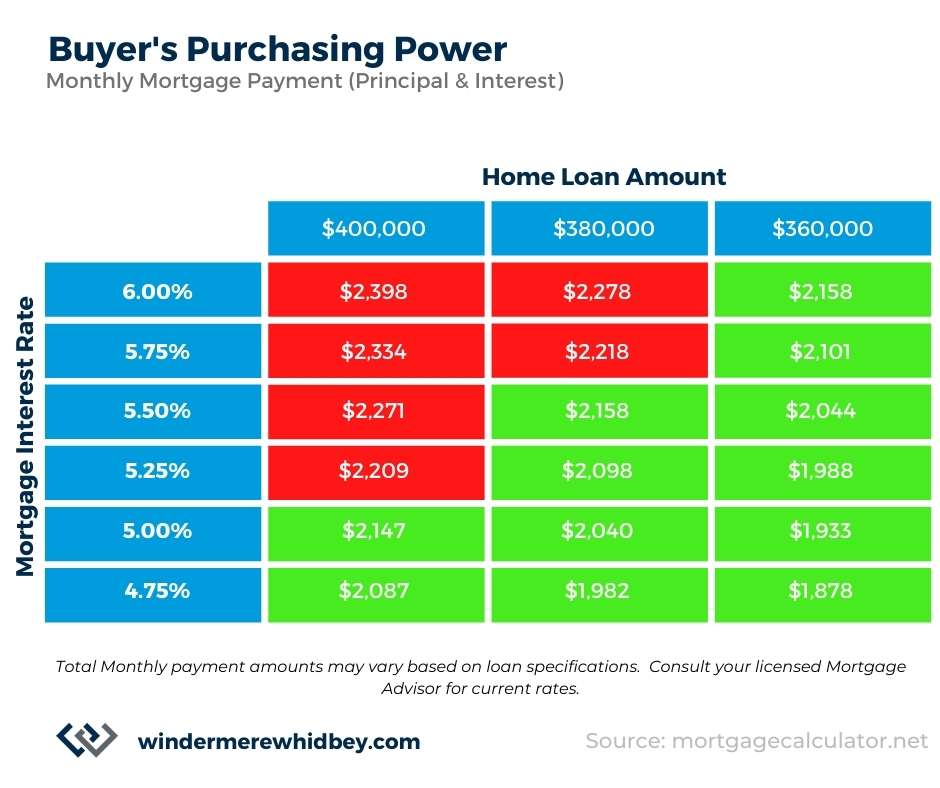
Mortgage Rates
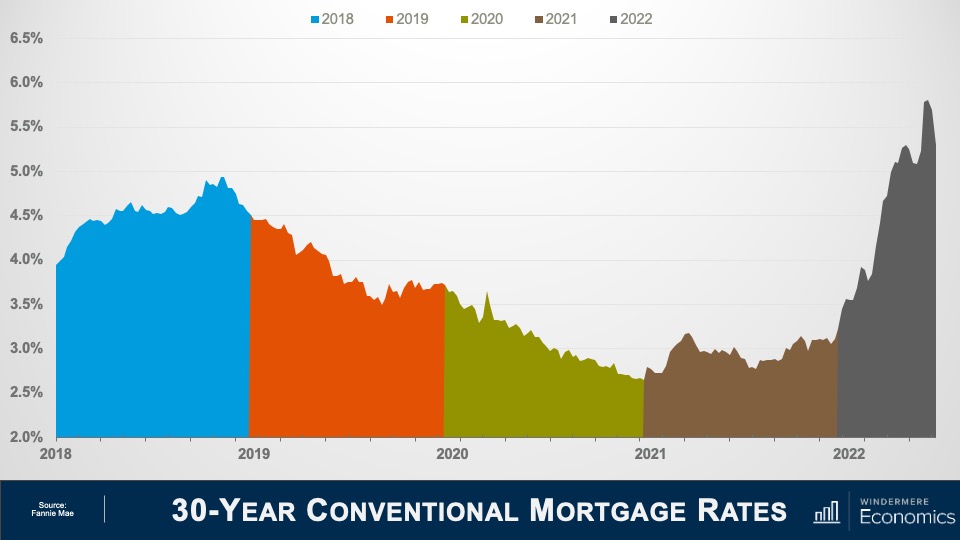
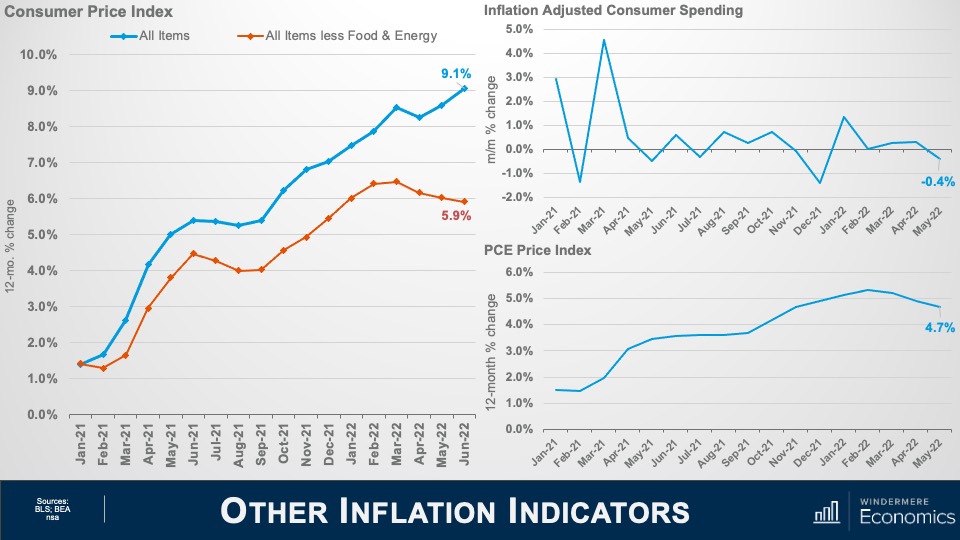
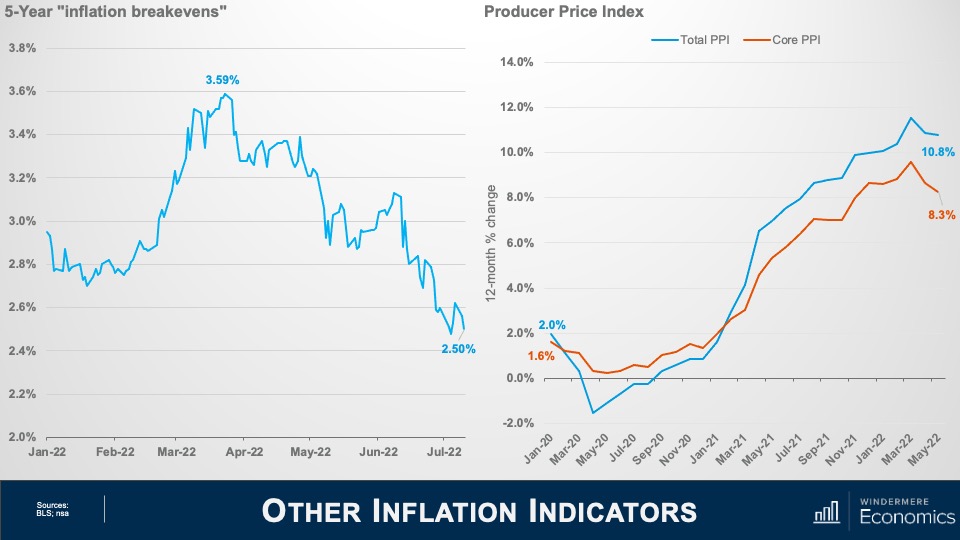
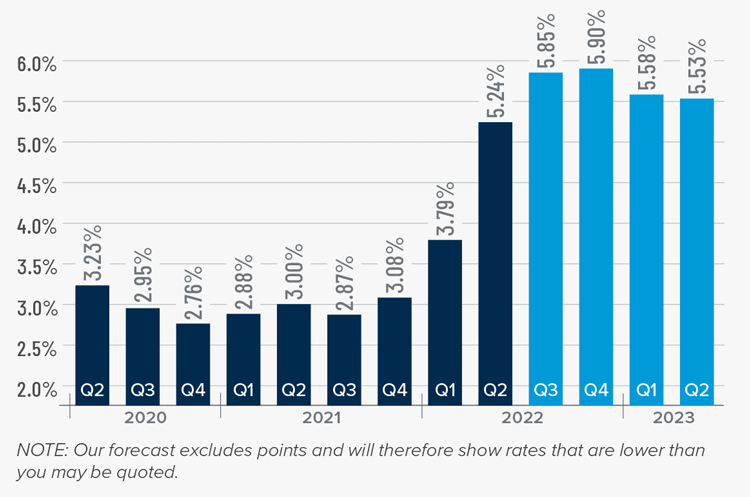
Although mortgage rates did drop in June, the quarterly trend was still moving higher. Inflation—the bane of bonds and, therefore, mortgage rates—has yet to slow, which is putting upward pressure on financing costs.
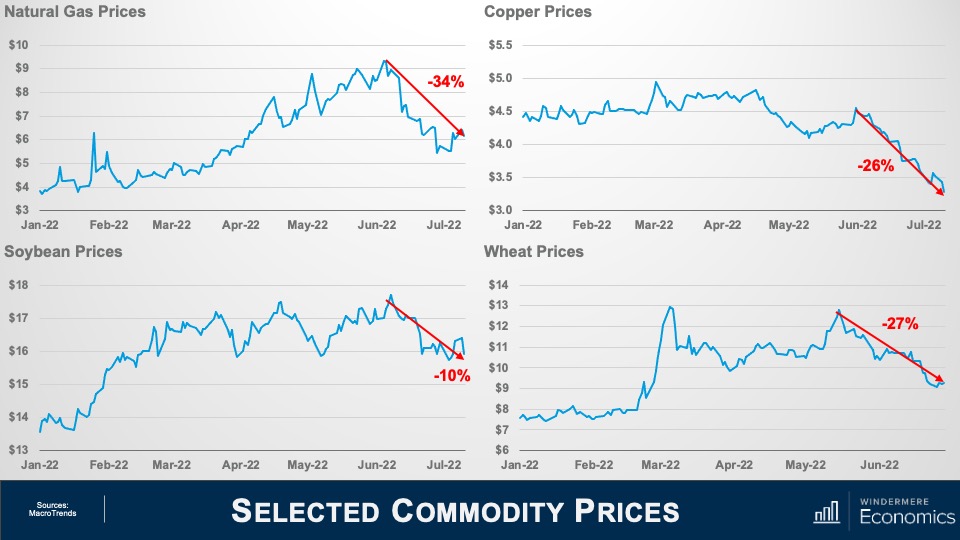
That said, there are some signs that inflation is starting to soften and if this starts to show in upcoming Consumer Price Index numbers then rates will likely find a ceiling. I am hopeful this will be the case at some point in the third quarter, which is reflected in my forecast.
Western Washington Days on Market
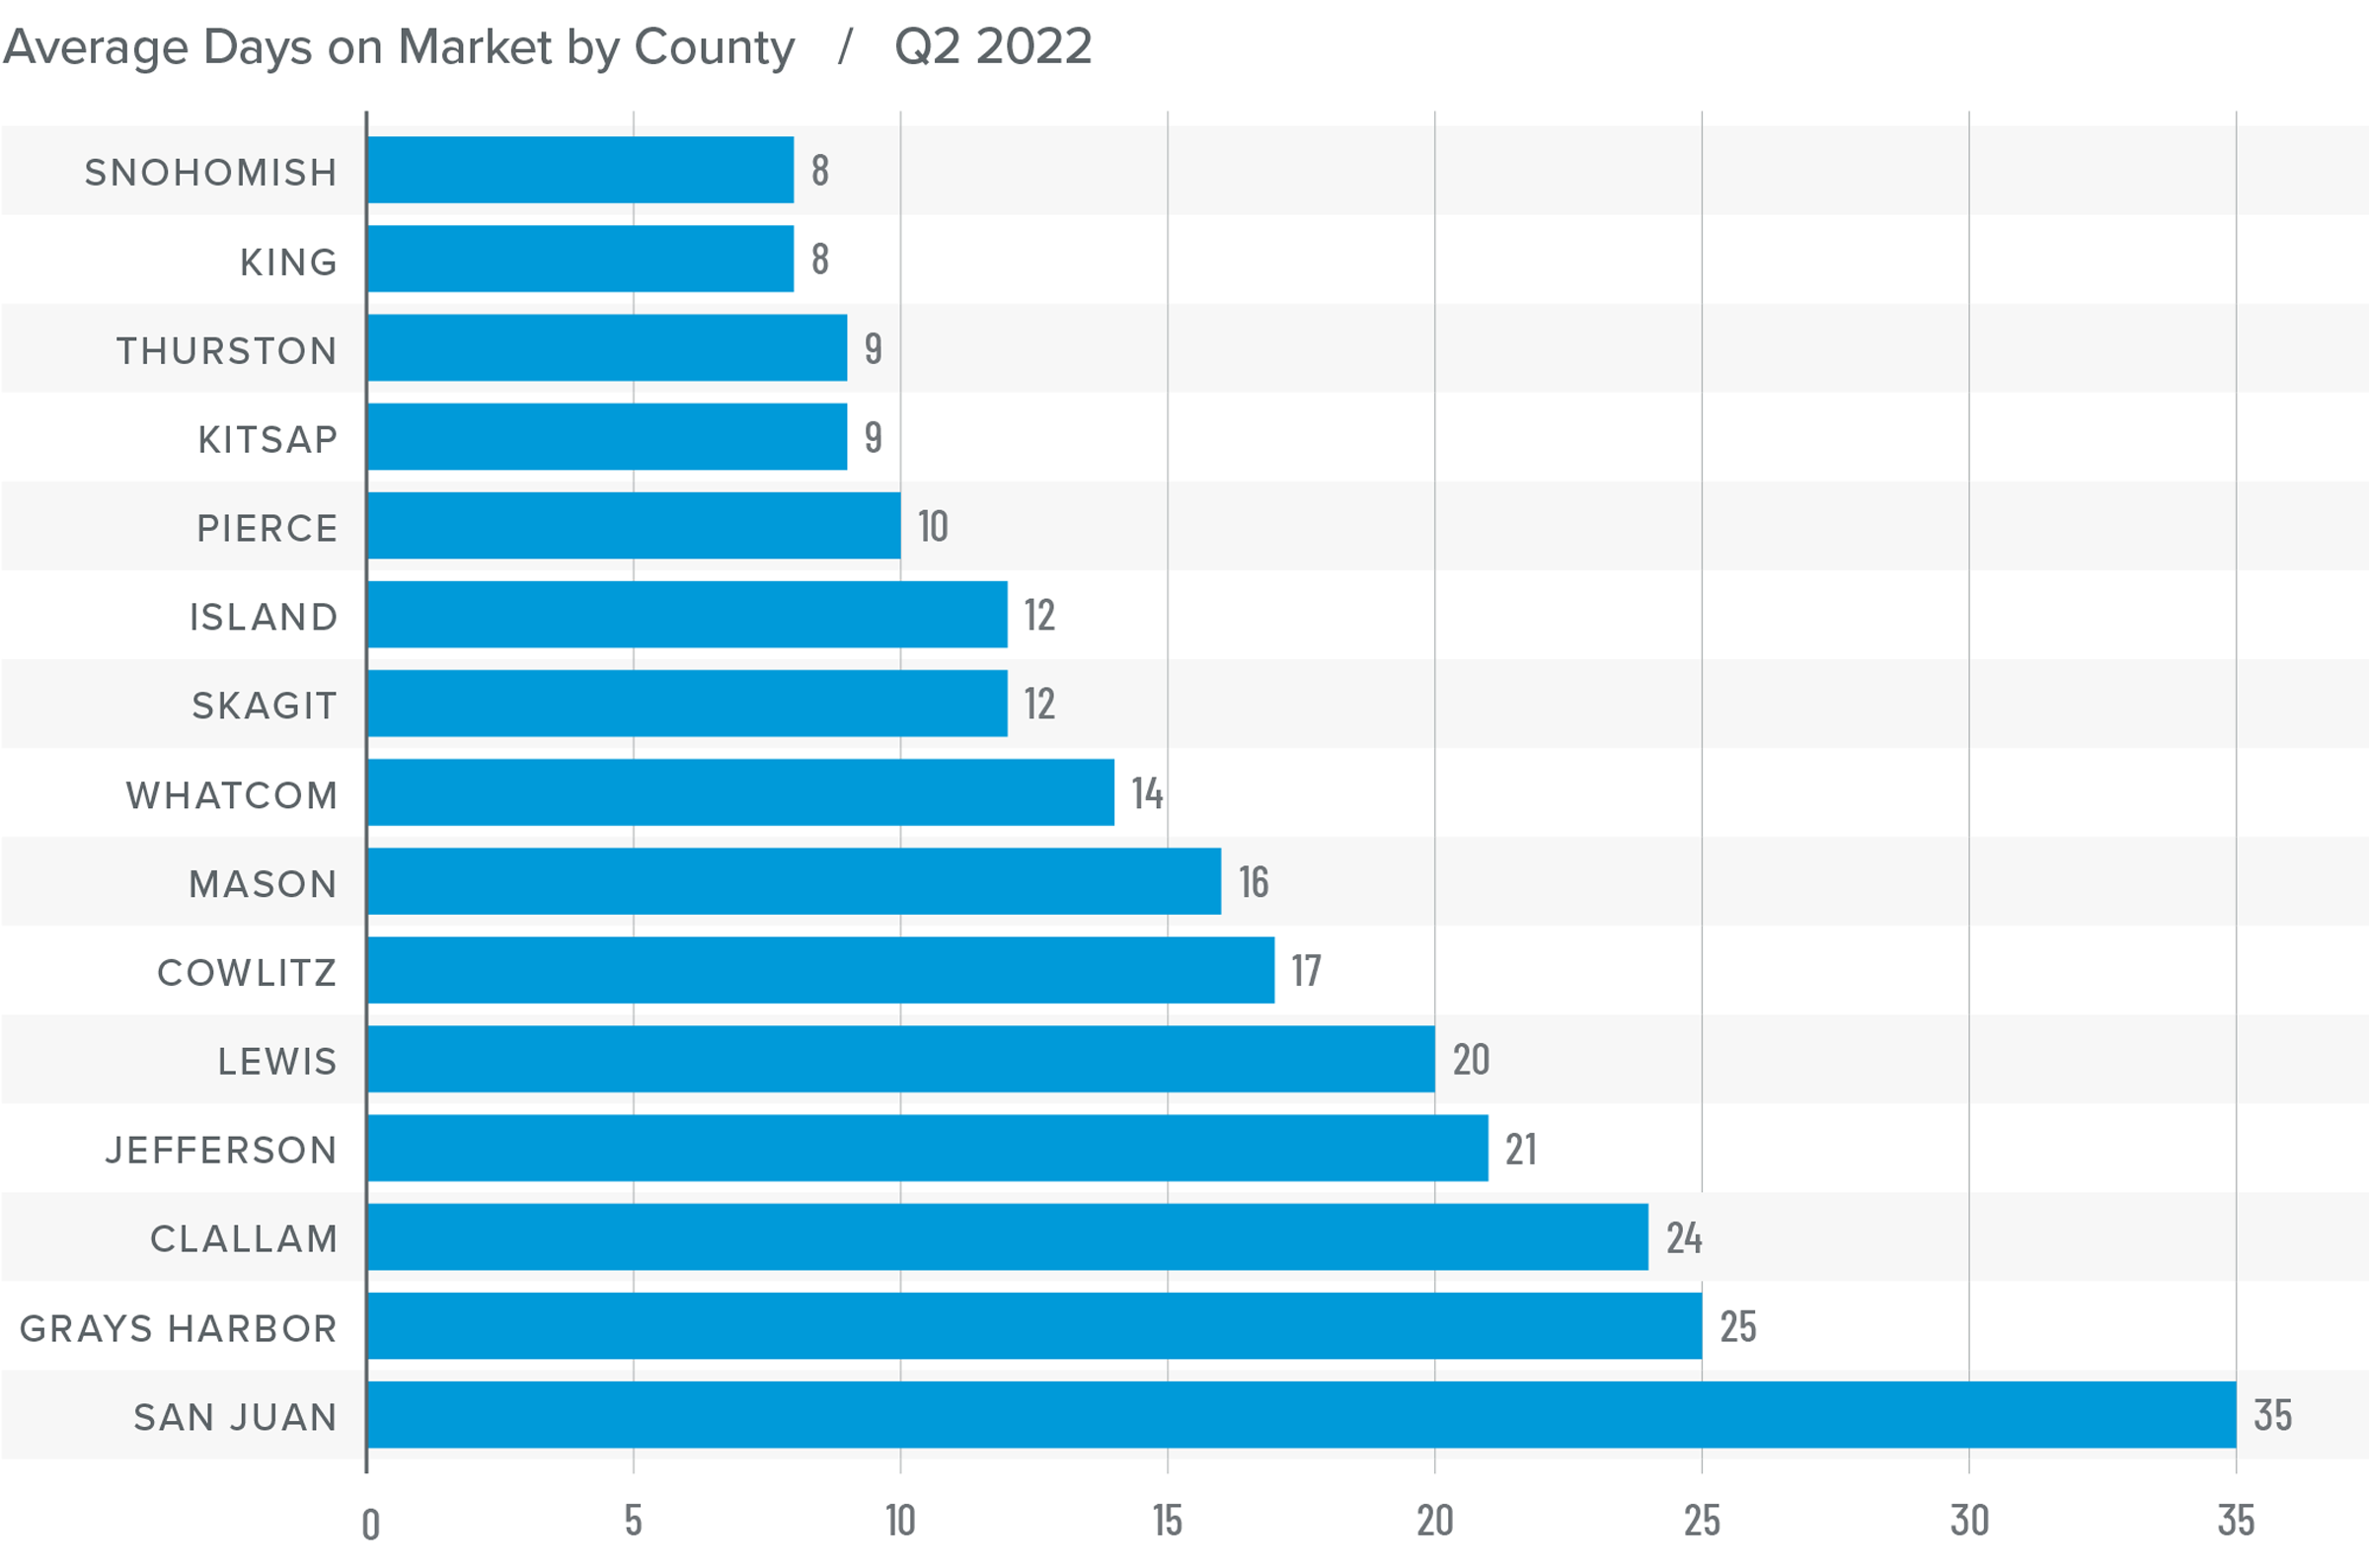
❱ It took an average of 16 days for a home to go pending in the second quarter of the year. This was 2 fewer days than in the same quarter of 2021, and 9 fewer days than in the first quarter.
❱ Snohomish, King, and Pierce counties were, again, the tightest markets in Western Washington, with homes taking an average of between 8 and 10 days to sell. Compared to a year ago, average market time dropped the most in San Juan County, where it took 26 fewer days for a seller to find a buyer.
❱ All but six counties saw average time on market drop from the same period a year ago. The markets where it took longer to sell a home saw the length of time increase only marginally.
❱ Compared to the first quarter of this year, average market time fell across the board. Demand remains very strong.
Conclusions
This speedometer reflects the state of the region’s real estate market using housing inventory, price gains, home sales, interest rates, and larger economic factors.
The economy remains buoyant, which is an important factor when it comes to the regional housing market, particularly as it affects buyers. Even though the number of homes that came to market has jumped significantly, which should favor those looking for a new home, demand is still robust, and the market remains competitive.

Much to the disappointment of buyers, rising listing prices suggest that sellers are clearly still confident even as financing costs continue to increase. While the pace of price growth is slowing, sellers are still generally in control. As such, I have moved the needle a little more in the direction of sellers. Until we see list-price growth and home sales slow significantly, we will not reach a balanced market.
About Matthew Gardner

As Chief Economist for Windermere Real Estate, Matthew Gardner is responsible for analyzing and interpreting economic data and its impact on the real estate market on both a local and national level. Matthew has over 30 years of professional experience both in the U.S. and U.K.
In addition to his day-to-day responsibilities, Matthew sits on the Washington State Governors Council of Economic Advisors; chairs the Board of Trustees at the Washington Center for Real Estate Research at the University of Washington; and is an Advisory Board Member at the Runstad Center for Real Estate Studies at the University of Washington where he also lectures in real estate economics.