This video is the latest in our Monday with Matthew series with Windermere Chief Economist Matthew Gardner. Each month, he analyzes the most up-to-date U.S. housing data to keep you well-informed about what’s going on in the real estate market.
Hello there. I’m Windermere Real Estate’s Chief Economist Matthew Gardner and welcome to the latest episode of Monday with Matthew. Over the past few months, analysts like myself have been starting to get our hands on early numbers from the Census Bureau and, although we won’t get the bulk of the data for another several months, I thought it would be interesting to take a quick look at some of the information that the government has put out specifically as it relates to patterns.
This is a relevant topic given the pandemic, with many people wondering if we saw a mass shift in where we choose to live because of COVID-19. This belief that we packed up and moved because of the pandemic is, at face value, quite credible, especially given that home sales in 2021 were at levels we haven’t seen since 2006. But the reality, at least from the data we have received so far, actually tells a different story.
Moving Patterns for U.S. Homeowners and Renters in 2021
We Move More Infrequently
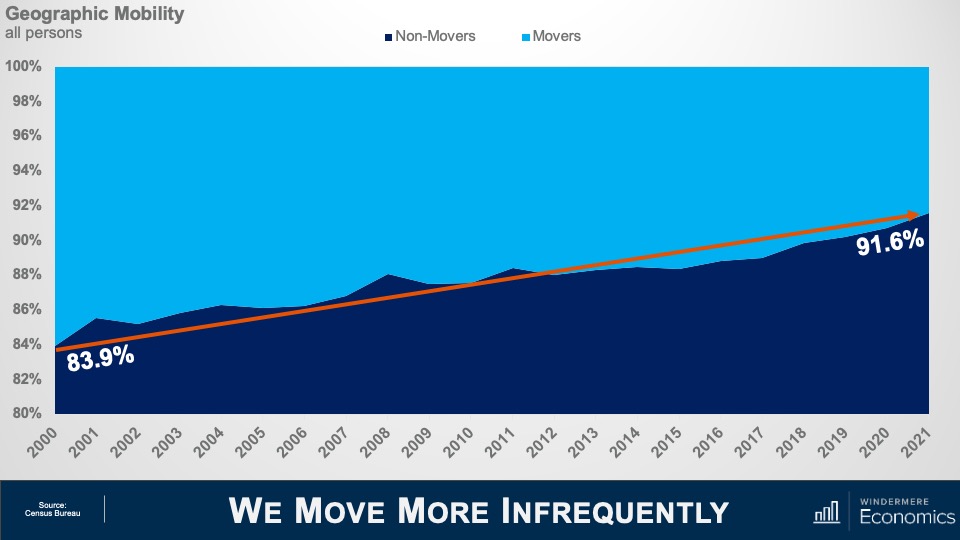
This first chart looks at people and not households and it shows that, contrary to popular belief, we’re actually moving less frequently now then we have done in decades, with the share of people not moving in a single year rising from just about 84% to over 91½%. Of course, we are having fewer children now than we did, but not to the degree that would change the trend.
Unsurprisingly, Renters Move More Often than Owners
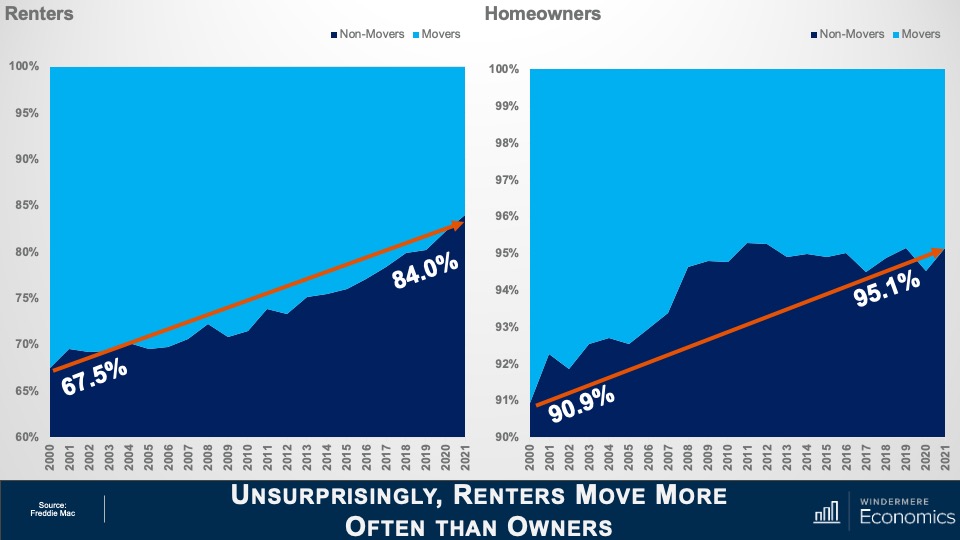
And when we break this down between homeowners and renters there is quite the discrepancy between the two groups. Although the number of renters not moving has risen from 67½ percent up to 84% since 2000, the number of homeowners staying put has moved from almost 91% all the way up to 95% last year.
So, the data thus far is not suggesting that we saw any form of mass exodus following the pandemic, in fact we haven’t been moving as much for the past 2-decades, but people did move since COVID-19 hit and the reasons they did were fascinating. The following charts are broken up into four categories of movers: those who moved for family reasons; those who moved for employment related reasons; those that moved for housing related reasons; and finally, those that moved for other reasons.
Reasons to Move (1)
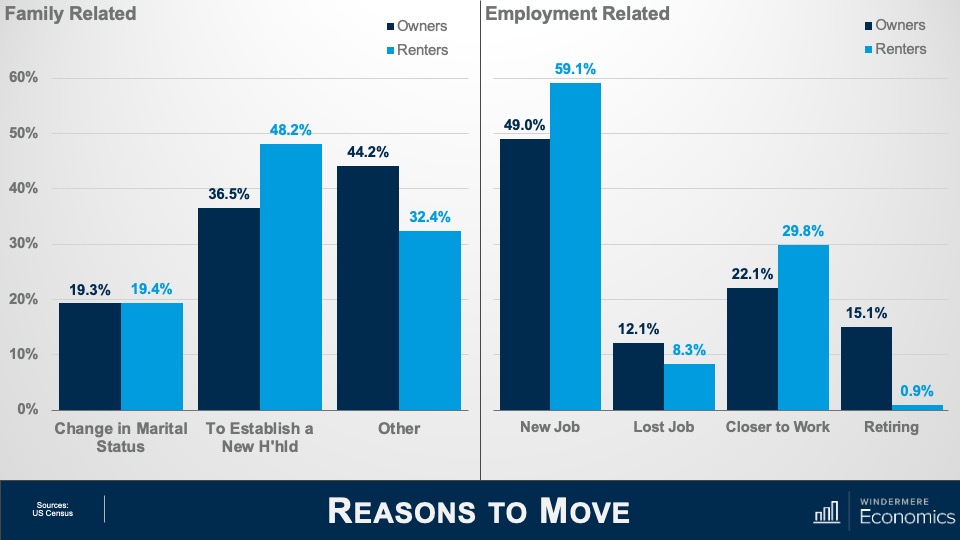
So, starting with family-related reasons, it was not surprising to see the major reason for both owners and renters to move was to establish a new household, nor was it surprising to see a greater share of renters headed out on their own than homeowners. Finally, the share of those moving because of a change in marital status was essentially the same between renters and homeowners. And when we look at employment related reasons for people moving last year, a greater share of renters moved because of a new job than homeowners, and more renters moved to be closer to their workplaces than did homeowners. Again, not really surprising, given that a large share of renters work in service-based industries and therefore proximity to their workplaces is important. You will also see that a greater share of homeowners than renters moved because they lost their jobs and, finally—and not at all surprisingly—far more homeowners moved because they chose to retire than renters.
Reasons to Move (2)
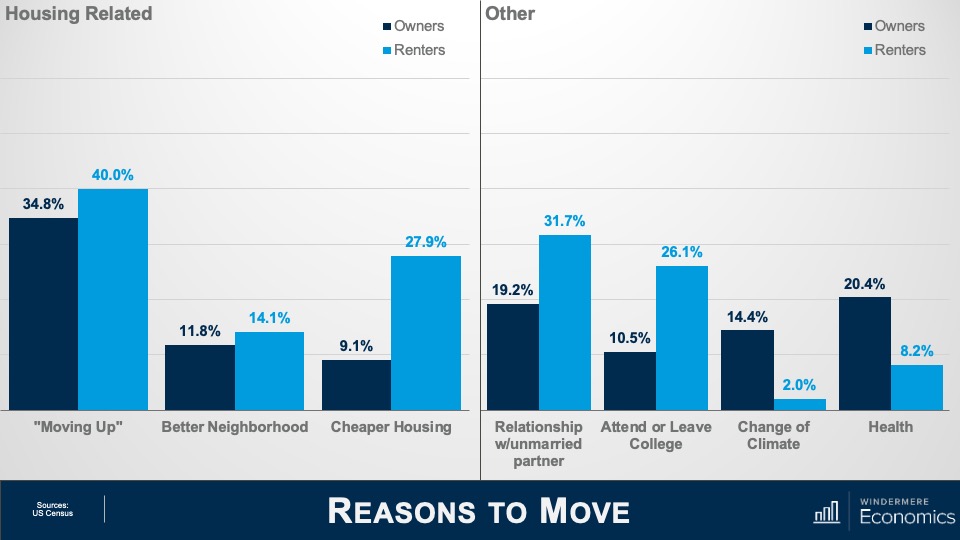
And when we look at housing related reasons that people moved, a large share of owners and renters moved from their current home or apartment and into a new, bigger, better house or apartment. A statistically significant share looked to move into a better neighborhood, and I do wonder whether owners were doing this because of the ability to work from home and possibly move to a better location further away from their workplaces. And even though renters tend to stay closer to their workplaces, I wonder whether these renters weren’t in white-collar industries and that the ability to work from home has led them to move into an area that they perceive to be better suited to them.
And finally, a significant share of renters moved because of the fact that rents have been skyrocketing over the past 18-months or so. This clearly impacted some homeowners, too. And finally, under the “other” category, more renters than owners moved because they were either entering or exiting a relationship with a domestic partner, and more renters left to either go to college or because they had completed their degrees.
Health-related reasons for moving had a significant impact on homeowners over renters, and I found it particularly interesting to see a lot of owners saying that “climate” was a reason for their move. Of course, I can only hypothesize as to whether people are simply looking to move to warmer climates or whether climate change is starting to have an increasingly large influence on where we choose to live. My gut tells me that climate change is becoming a far more important consideration for homeowners, although we can’t deny that a lot of people, specifically on the East Coast, moved South during the pandemic.
These next few charts break down movers not just by whether they our owners or renters but also by ethnicity.
2021 Mobility by Ethnicity & Tenure: Owners vs Renters Movers and Non-Movers
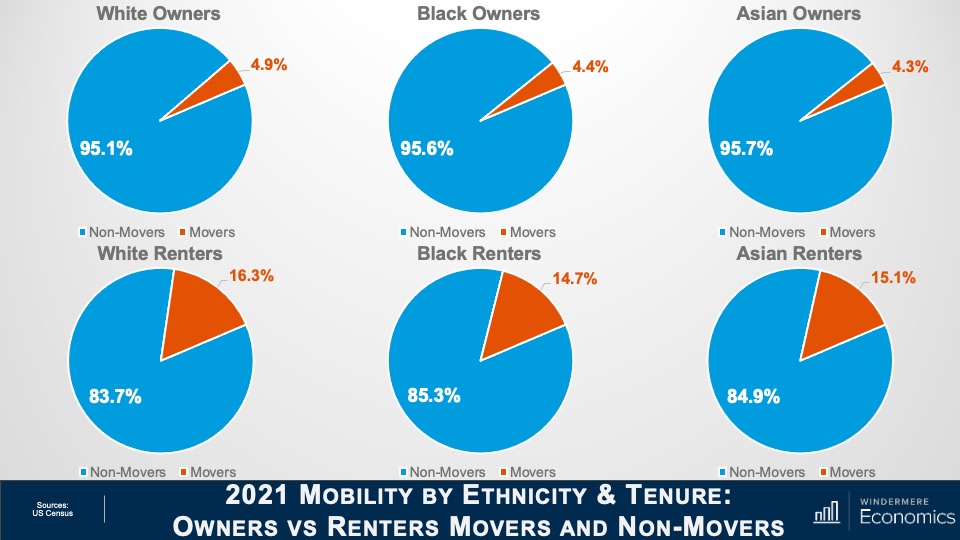
Here you can see that homeowners across these three ethnicities were pretty much uniform in their desire to stay in their existing home with only 4 to 5% moving. And renters who, as we have already seen, did move more frequently last year than homeowners, were also in a very tight range at between 83 and 85%.
2021 Mobility by Ethnicity & Tenure: Owners vs Renters Movers and Non-Movers (2)
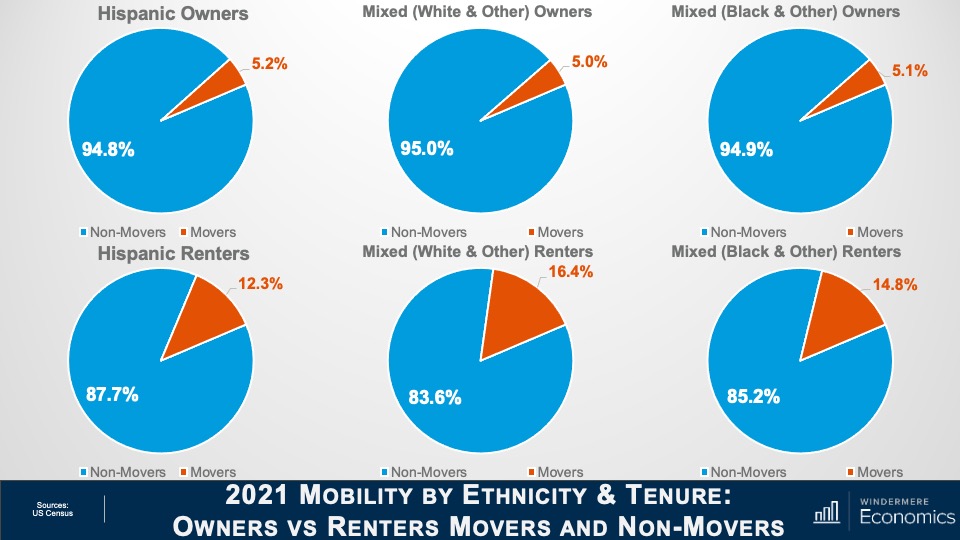
And the same can be said about Hispanic owners and mixed race families, with about 95% not moving last year. Now this is modestly lower than White, Black, or Asian households, but the difference is very marginal. As for renters, between 83 and almost 88% of them within these three ethnicities moved last year, but you will see a bigger share of Hispanic renters stayed put as opposed to all the other ethnicities shown here.
2021 Mobility by Ethnicity & Tenure: Moves In & Out of State
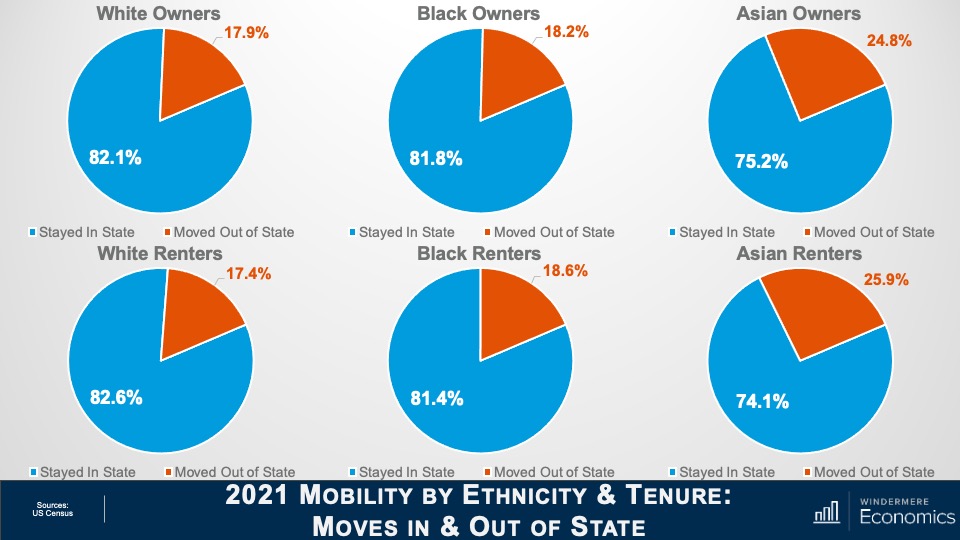
Looking closer now at those who did move, even though fewer Asian households moved when compared to all other ethnicities, far more left the state than stayed, and the same was true for Asian renters with over a quarter moving out of state.
2021 Mobility by Ethnicity & Tenure: Moves In & Out of State (2)
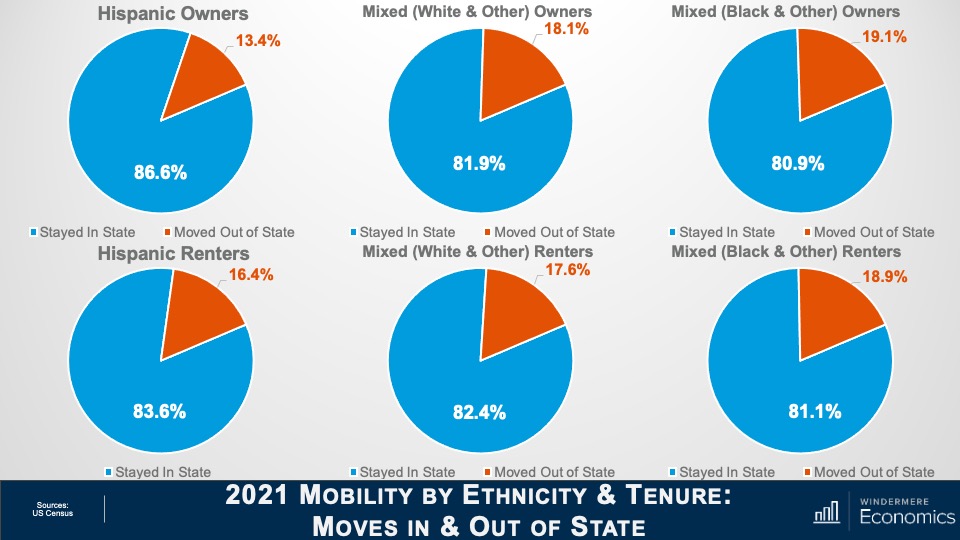
Again, a greater share of the Hispanic homeowners who did move last year stayed in the state where their old house was, and the share of mixed households was roughly at the average for all ethnicities. And the share of Hispanic and mixed-race renters who stayed in State was also about average.
What I see from the data is that the huge shift that many expected during COVID has not been affirmed—at least not by the numbers we have looked at. That said, we are sure to see numerous revisions because of the issues that COVID 19 has posed on Census takers, so we may get a different story as more data is released and revisions posted. What I found to be most interesting in the numbers we have looked at was the massive increase in renters moving in with their “significant others.” But I am not surprised, given that there are around 48½ million people aged between 20 and 30, and this is their time!
And I was also interested in the share of the population who moved due to climate. I will be doing some more digging around in the darkest recesses of the Census Bureau website to see if I can find out more about this. Although I can’t confirm it, my gut tells me that climate—and specifically climate change—will be a factor of growing importance when people are thinking about where they want to live.
And there you have it. As always, if you have any questions or comments about this particular topic, please do reach out to me but, in the meantime, stay safe out there and I look forward to visiting with you all again next month.
Bye now.