Facebook
 X
X
 Pinterest
 Copy Link


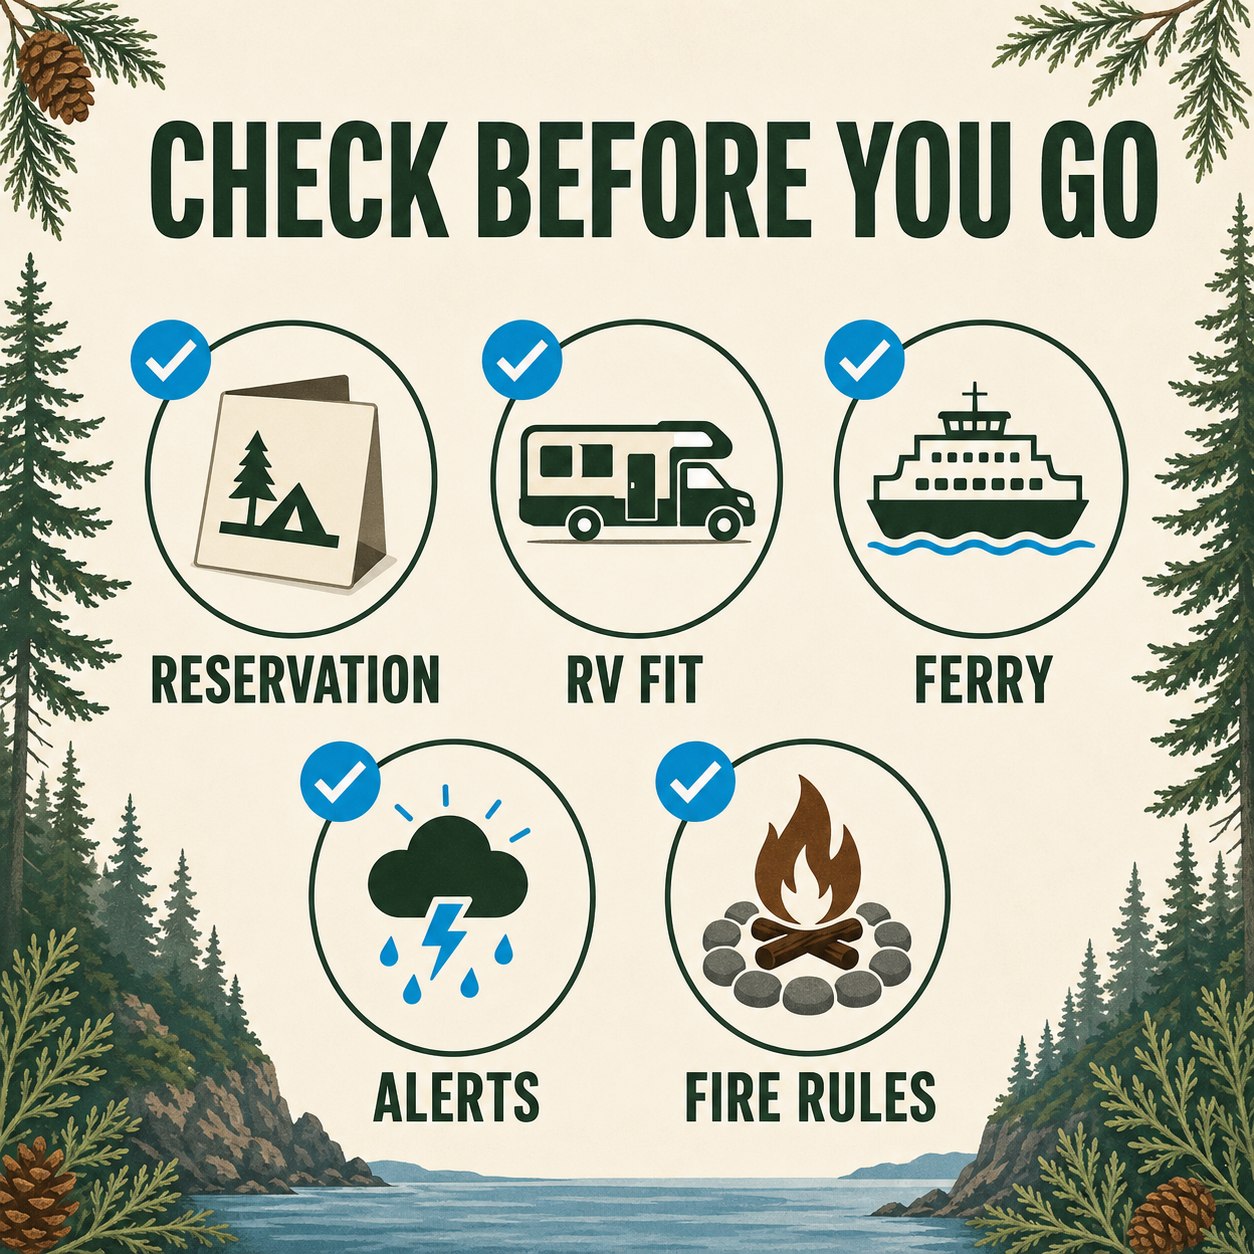


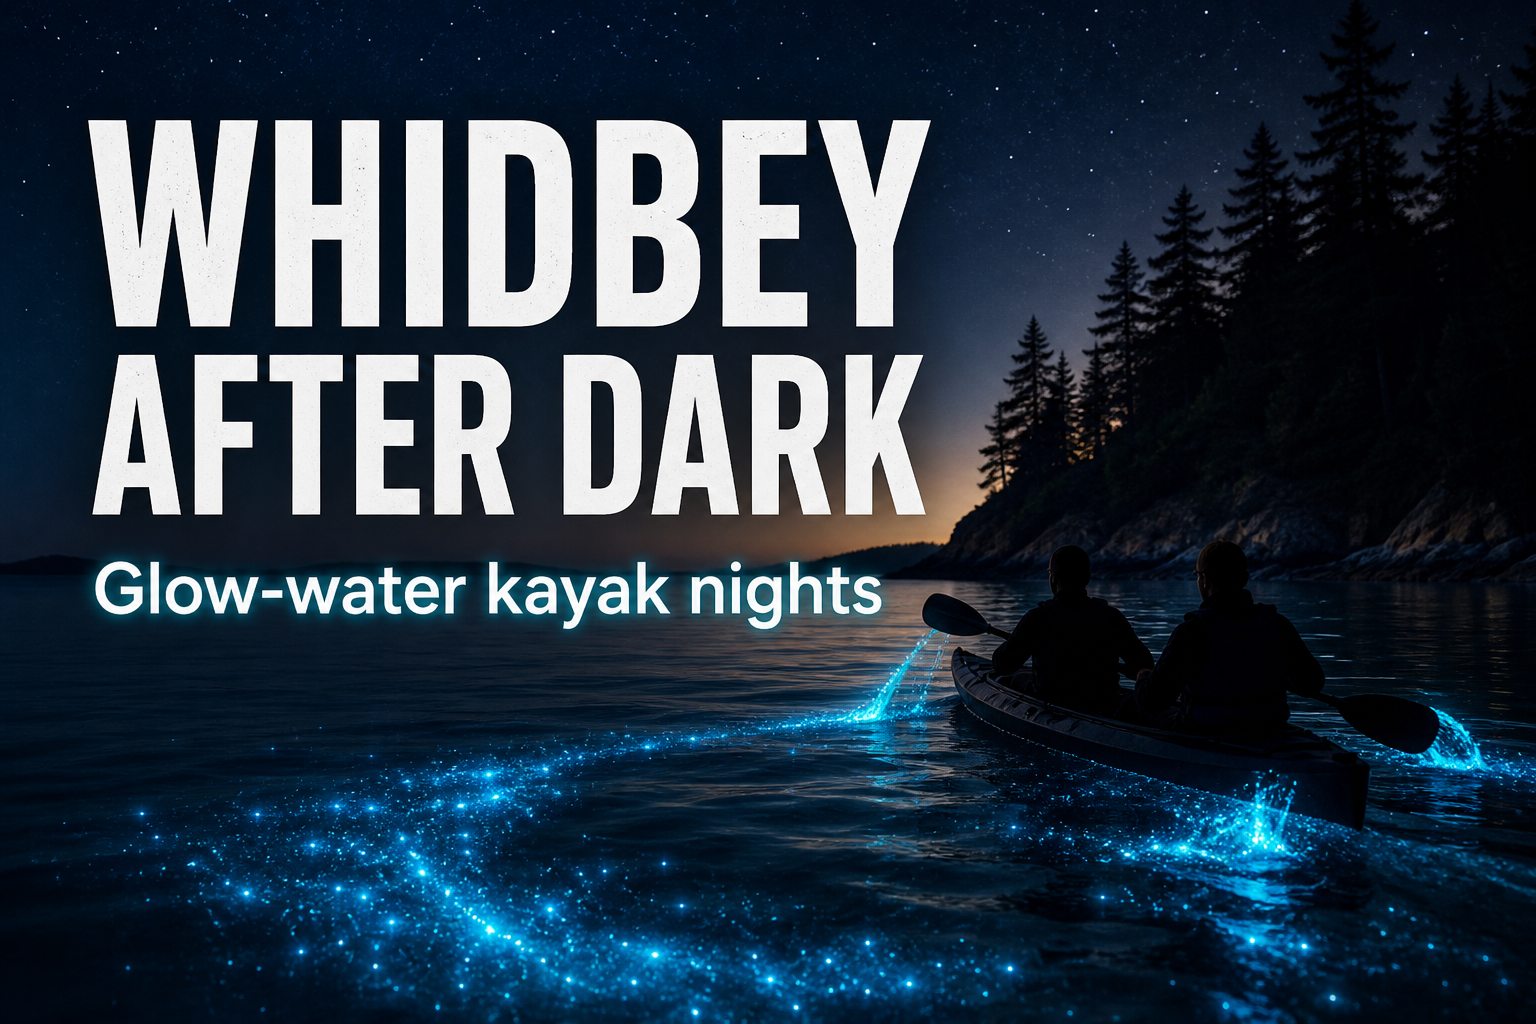
Image note: The visuals in this article are editorial guide images created to explain Whidbey bioluminescence kayaking. They are not documentary photos from a specific tour, date, launch, business, or on-water moment.
If Whidbey had a night mode, this would be it. Dark water. Quiet paddles. Salt air. And, if the timing is right, blue-green sparkles lighting up around your kayak like Puget Sound decided to show off.
Bioluminescence kayaking is not about racing across the water or checking off another scenic viewpoint. You are not going out to cover distance. You are going out to watch the water answer back, which is objectively a better party trick than anything your phone can do.
Around dark summer moon cycles, tiny marine organisms in Puget Sound can glow when the water is disturbed. A paddle stroke, a hand in the water, or the wake beside a kayak can create quick blue-green flashes. It is not a guaranteed theme-park light show, and no responsible guide can promise exactly how bright it will be on a given night. That uncertainty is part of the magic.
Quick Takeaways
- Best for: curious locals, summer visitors, older kids/teens, and anyone who wants a memorable night on the water.
- Best local resource: Whidbey Island Kayaking.
- Good to know: 2026 listings describe the experience as 2 hours, ages 10+, tandem kayaks, and no previous experience needed.
- Not ideal for: people who want a hard paddle workout, guaranteed bright conditions, or an early bedtime.
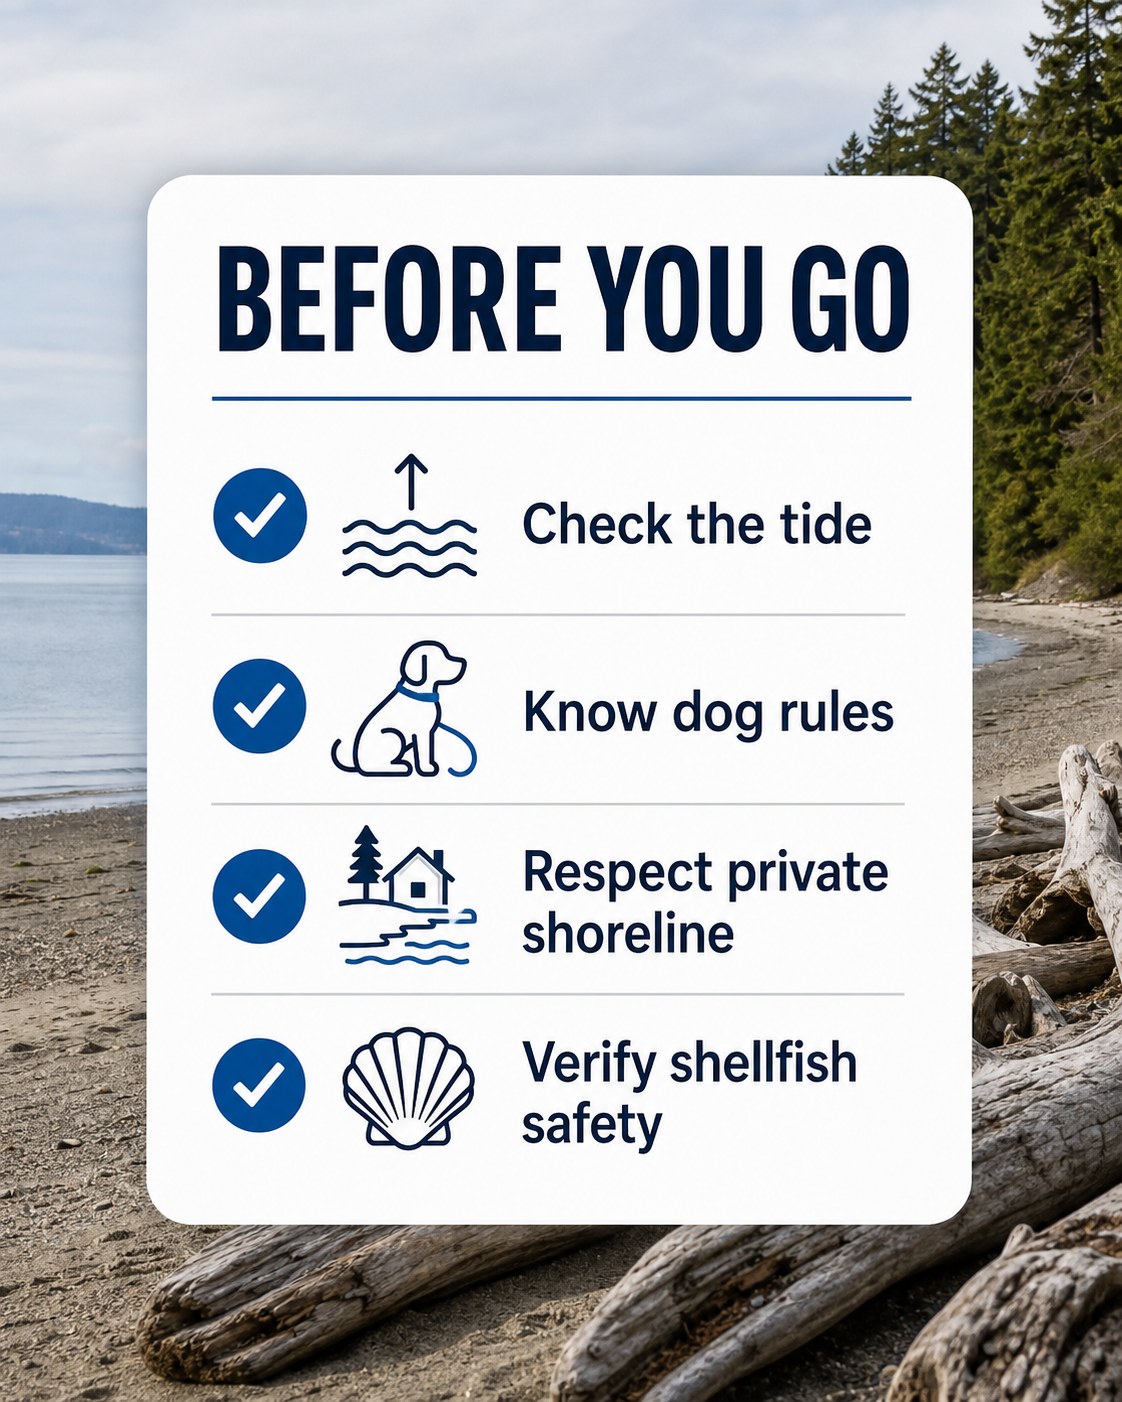
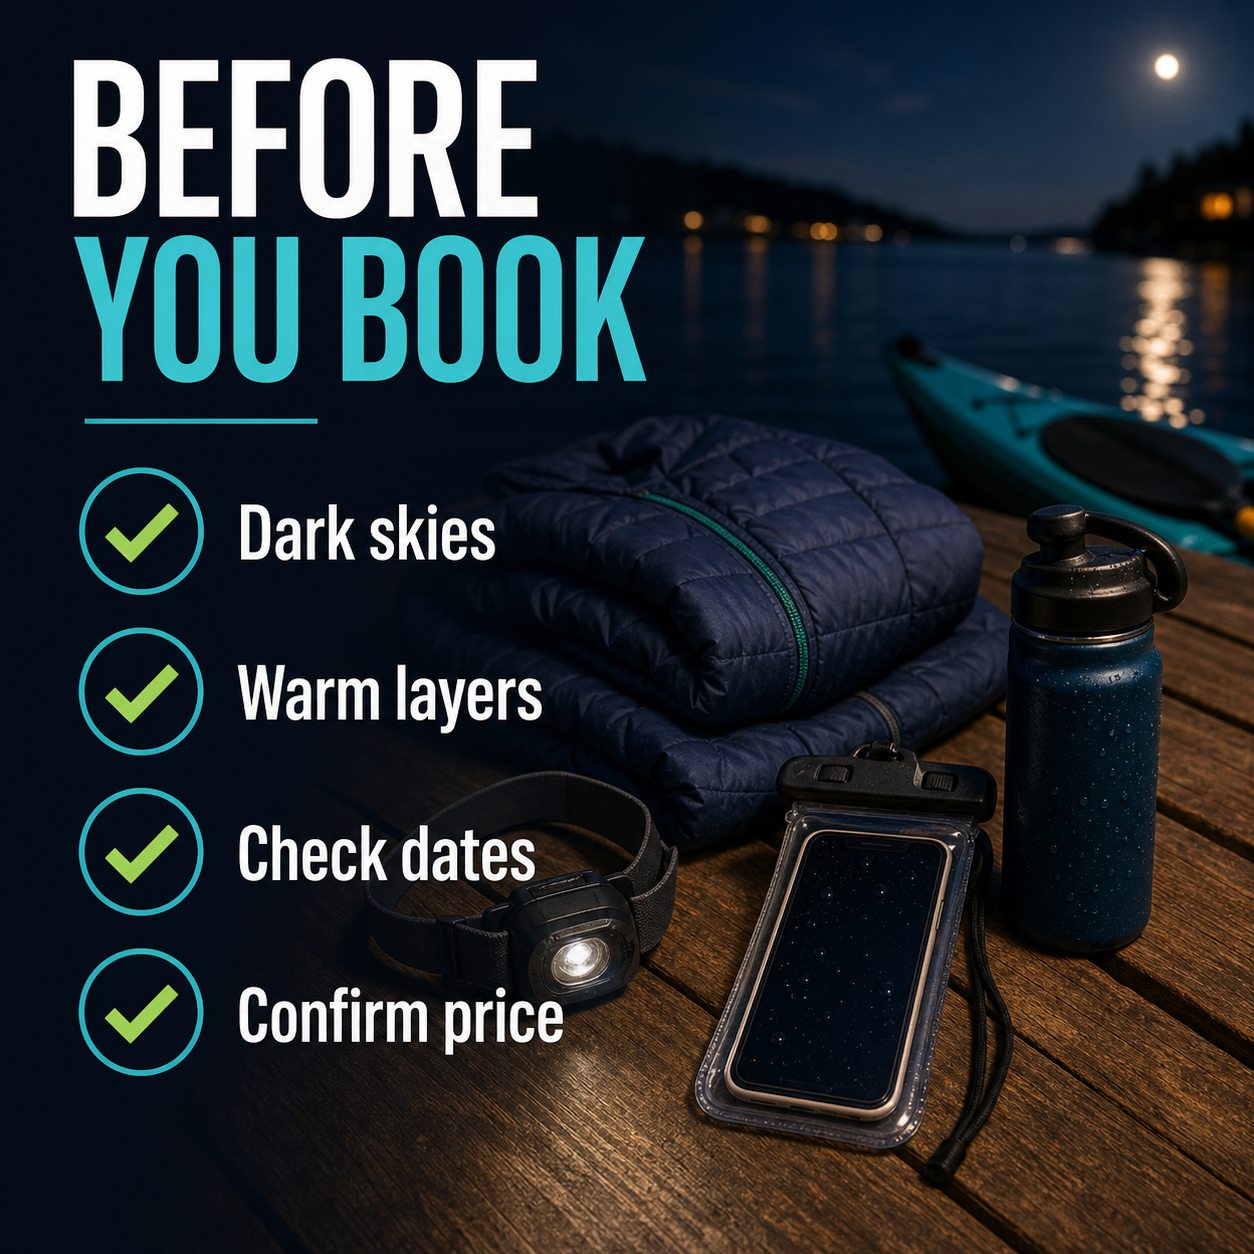
- Before you go: check dates, price, weather, start time, cancellation rules, and what to bring.
The Quick Answer
If you are looking for a Whidbey Island bioluminescence kayak experience, start with Whidbey Island Kayaking. Their current bioluminescence page describes a guided nighttime kayak experience on Puget Sound, offered only a few times during summer when dark skies around new moon periods give the best viewing chance.
Why a guided paddle matters:
This is for people who want the glow-water night without personally solving tides, currents, launch logistics, gear, darkness, safety, and “wait, where exactly do we park?” all at once.
Helpful links:
Whidbey Island Kayaking bioluminescence page
Whidbey Island Kayaking main site
Whidbey/Camano tourism event listing
Whidbey Island Kayaking on Whidbey/Camano tourism
South Whidbey Harbor at Langley
Whidbey Island Kayaking on Google Maps
What Bioluminescence Kayaking Actually Is
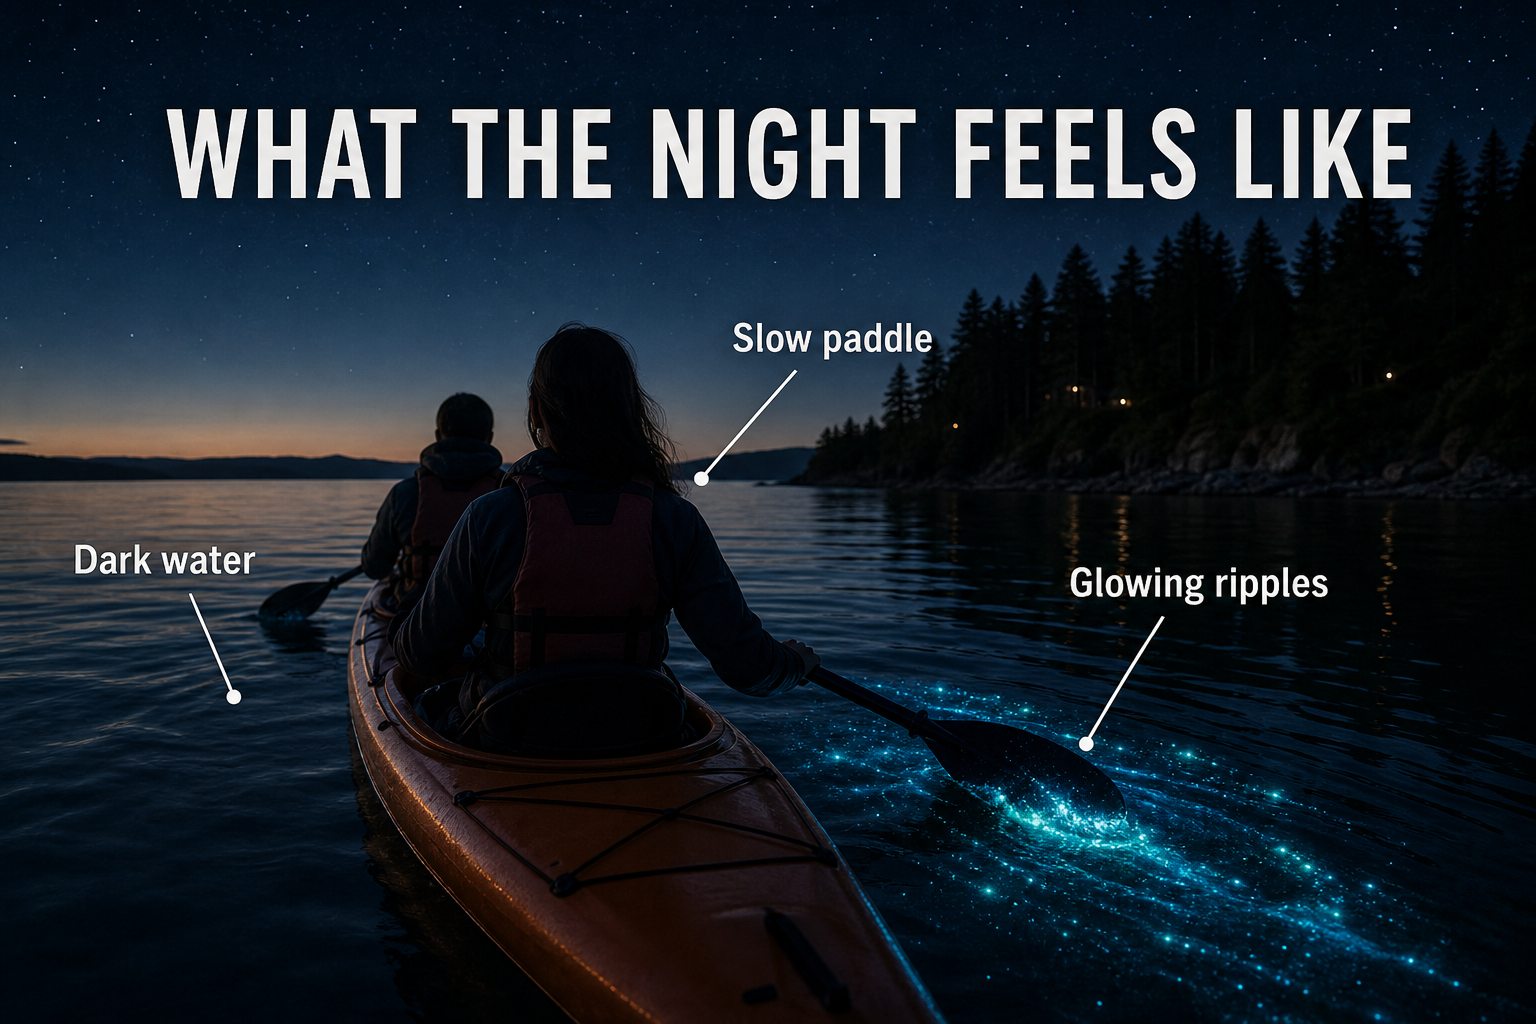
Bioluminescence is light produced by living organisms. In Puget Sound, the glow people hope to see on night paddles is often caused by tiny marine organisms that flash when the water is disturbed. The effect can look like sparkles, streaks, or small bursts of blue-green light around a paddle, hand, or moving kayak.
Set your expectations this way:
This is not neon water glowing evenly from shore to shore. It is more subtle and more intimate: dark water, quiet paddling, stars if the sky cooperates, and little flashes that appear when the water moves.
When The 2026 Whidbey Bioluminescence Dates Are Listed
The Whidbey/Camano tourism listing currently shows 2026 bioluminescence dates grouped around dark summer nights:
- June: 12, 13, 14, and 15 at 10:00 p.m.
- July: 9, 10, 11, 12, 13, 14, and 15 at 10:00 p.m.
- August: 8, 9, 10, 11, 14, 15, and 16 at 9:30 p.m.
- September: 4, 5, 6, 11, and 12 at 9:00 p.m.
The same listing describes the experience as 2 hours, ages 10+, no previous experience needed, tandem kayaks, and shared tours, with pricing currently listed at $120 per paddler plus taxes and fees. Because tour pricing, availability, and details can change, use those numbers as a current planning reference and check Whidbey Island Kayaking’s booking page before making plans.
Featured Local Resource: Whidbey Island Kayaking
Whidbey Island Kayaking also offers daytime tours, private adventures, retreats, classes, and rentals from April through October. So if a nighttime paddle is not the right fit, or if your group would rather see the shoreline in full daylight, their main site is still a useful place to start.
That local guide piece matters. Whidbey water is beautiful, but tides, wind, currents, cold water, darkness, launch logistics, and changing conditions are not things to casually improvise. For first-timers and limited-experience paddlers, a guided outing is the calmer, smarter way to enjoy the water.

If a night on the water has you thinking beyond a single paddle, look at current Whidbey waterfront listings with a practical eye toward access, exposure, shoreline rules, and everyday maintenance.
What To Expect On The Water
Expect the pace to be slower than a normal sightseeing paddle. Whidbey Island Kayaking describes the bioluminescence experience as more of a float than a distance paddle, because there can be plenty to see close to shore in intertidal waters.
The night usually includes:
- Setup, safety, gear, and getting comfortable in tandem kayaks.
- A quieter paddle pace so your eyes can adjust to the dark.
- Watching for glow where paddles, hands, or kayaks disturb the water.
- A reminder that some nights are brighter than others because nature is delightfully unconcerned with our schedule.
Cloud cover, moonlight, plankton concentration, wind, and water conditions can all affect the experience. This is one reason the article should not promise “guaranteed glow.” The better promise is a guided Whidbey summer night on the water with a real chance to see one of Puget Sound’s strangest and loveliest natural effects.
What To Bring And What To Skip
For a night paddle, comfort is about layers, timing, and being ready to listen to your guide. Check the tour’s current instructions before you go, but a sensible planning list includes:
- Warm layers, even if the day was hot.
- Shoes or sandals that can get damp.
- A headlamp if the tour requires or recommends it.
- A small water bottle.
- A phone secured in a waterproof pouch if you bring it.
- A realistic plan for late-night driving afterward.
One more practical note: save the celebratory drink for after the paddle. Being on the water after dark is much more fun when everyone is steady, alert, and able to follow guide instructions. Your kayak will appreciate your life choices.
Who This Is Best For
A Whidbey bioluminescence paddle is a good fit if you like quiet experiences, natural phenomena, small-group outings, and being outside after dark. It can work for beginners because the listed experience uses tandem kayaks and does not require previous experience, but beginners should still be honest about comfort level.
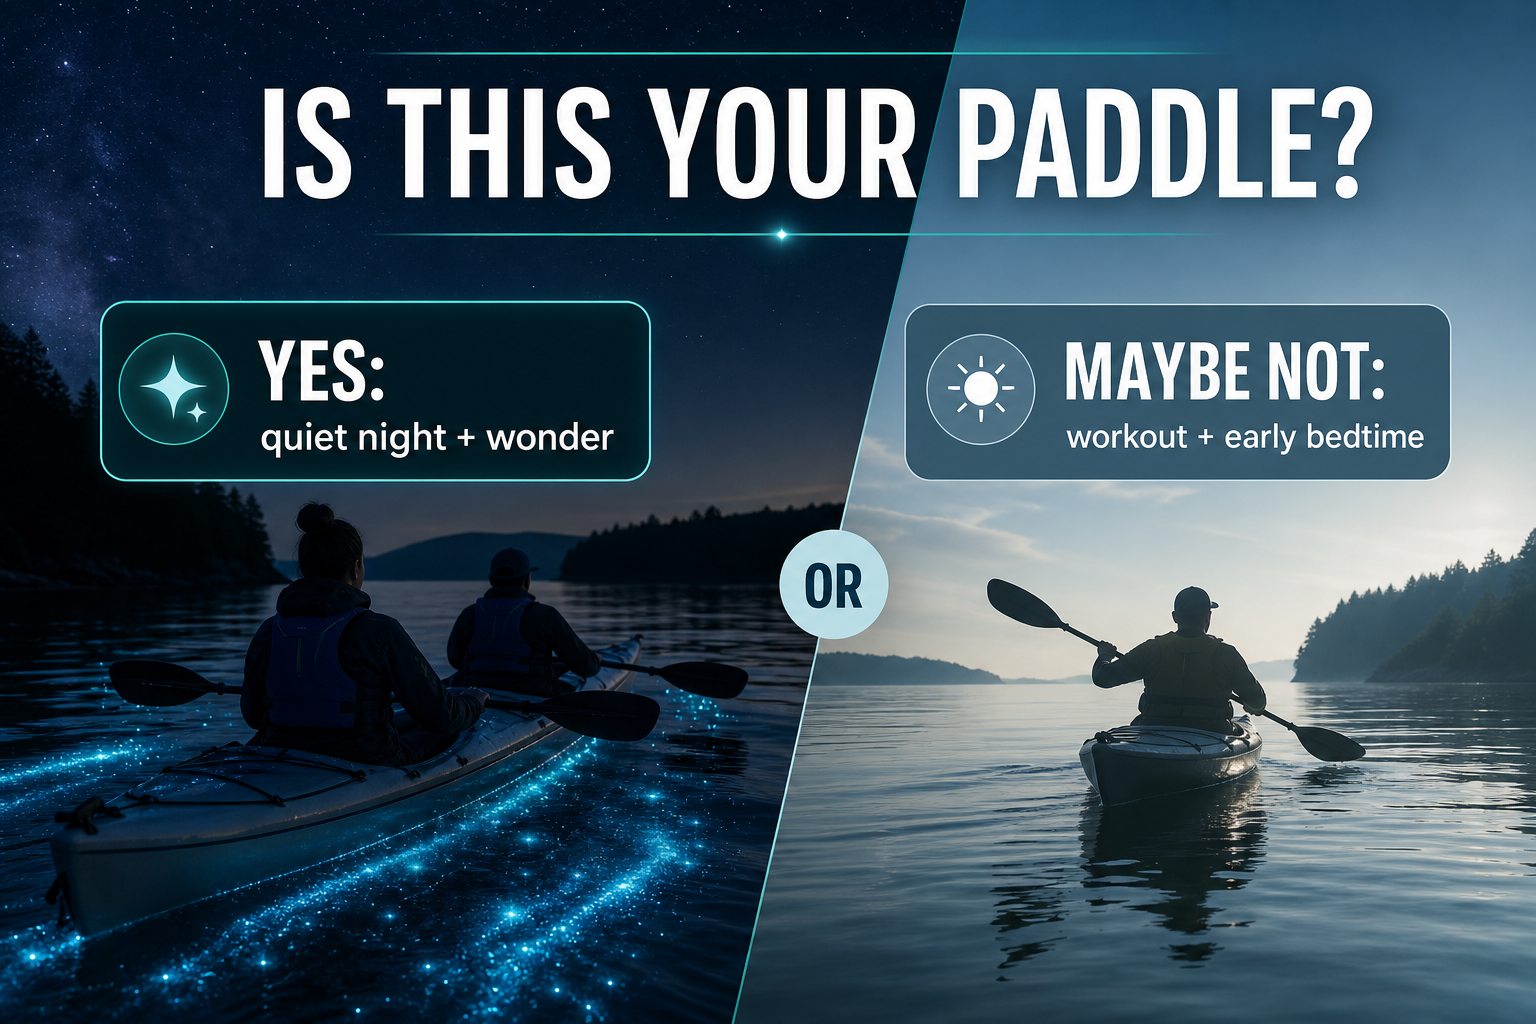
This is probably your paddle if you like:
- Quiet nights and slower experiences.
- Being close to the water.
- Natural phenomena that do not perform on command.
- A guided outing where someone else handles the hard logistics.
Maybe choose a daytime paddle instead if you want:
- A workout.
- A guaranteed bright visual show.
- An early bedtime.
- A trip with kids younger than the listed age minimum.
Pair It With A Langley Evening
Because Whidbey Island Kayaking is closely tied to Langley and South Whidbey Harbor, this works best as a Langley evening rather than a rushed drive-by activity. Have dinner early, walk the village, leave extra time for parking and waterfront wayfinding, and keep the post-paddle drive simple.
Local tip: Do not schedule your evening like you are teleporting from dinner table to kayak seat. Langley is charming, but it is still a real place with parking, waterfront paths, and clocks that insist on moving forward.
Useful local links:
South Whidbey Harbor at Langley
South Whidbey Harbor on Visit Langley
Windermere Whidbey Langley guide
South Whidbey Harbor on Google Maps

If a harbor walk, dinner in town, and a quiet paddle after dark sounds suspiciously close to your ideal version of island life, browse active Langley listings.
A Few Planning Notes Before You Book
Check the official booking page, not a saved screenshot or old article, before you commit. Confirm the date, start time, meeting location, current price, weather/cancellation rules, age minimum, what to bring, and whether you are booking a shared or private tour.
Especially if you are coming from off-island:
Check ferry timing before you build the evening plan. A 9:00 or 10:00 p.m. start can make for a late night after the tour ends, especially if you still need to drive back to Clinton and catch a ferry.
Related local reads:
Langley guide
Clinton guide
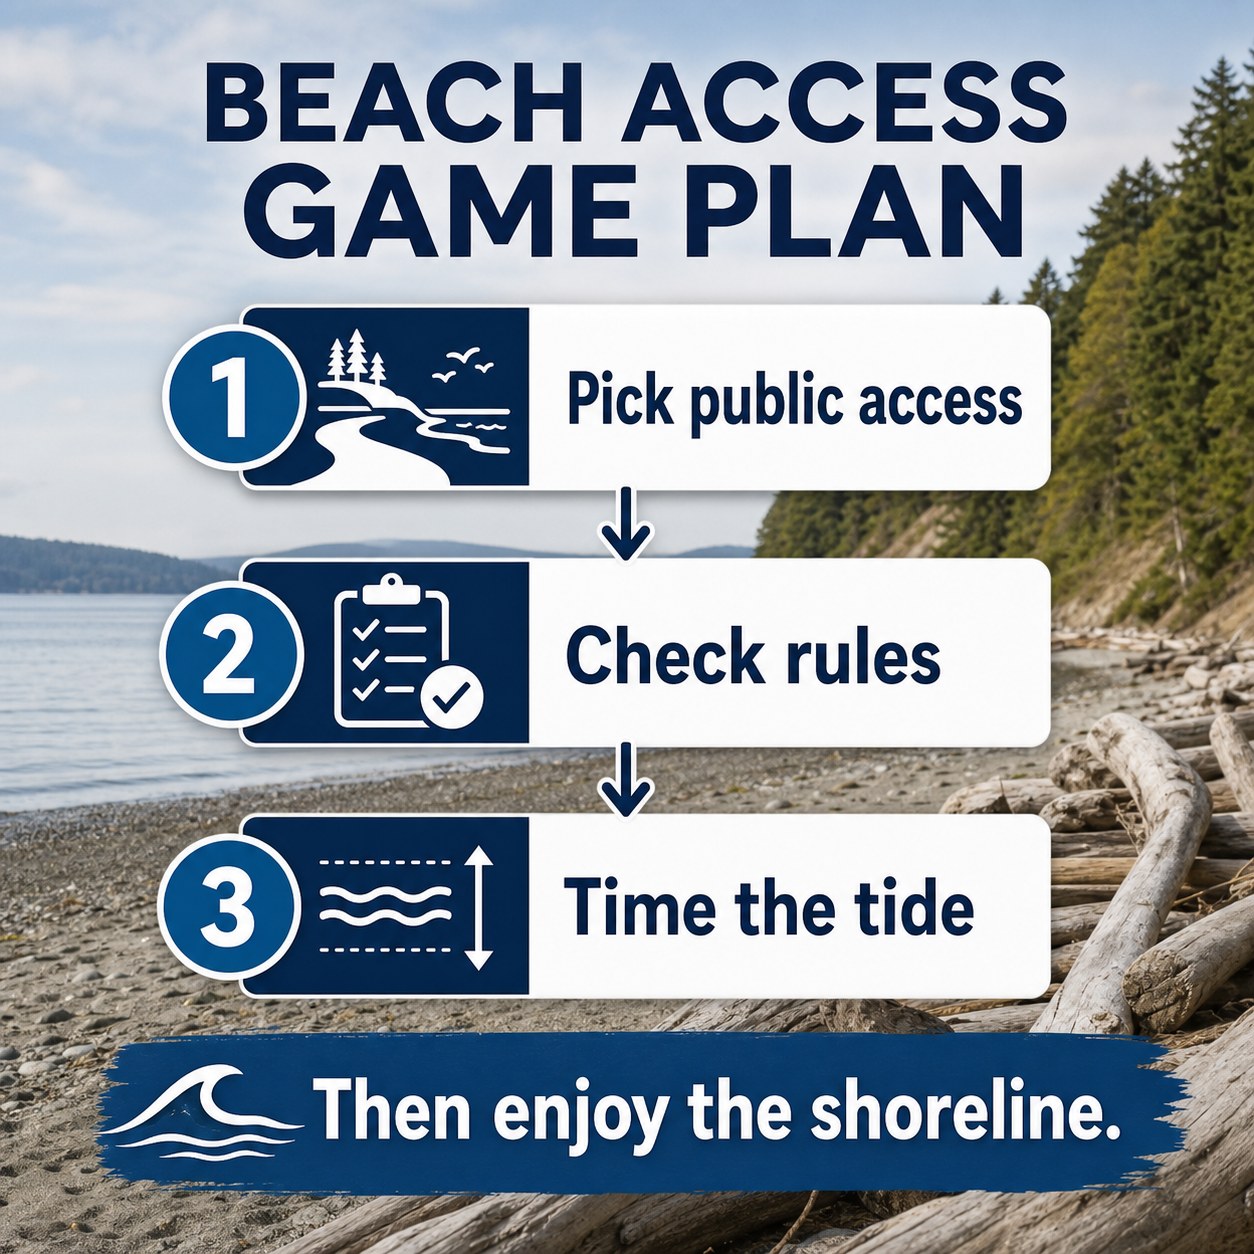
Whidbey Island beach access guide
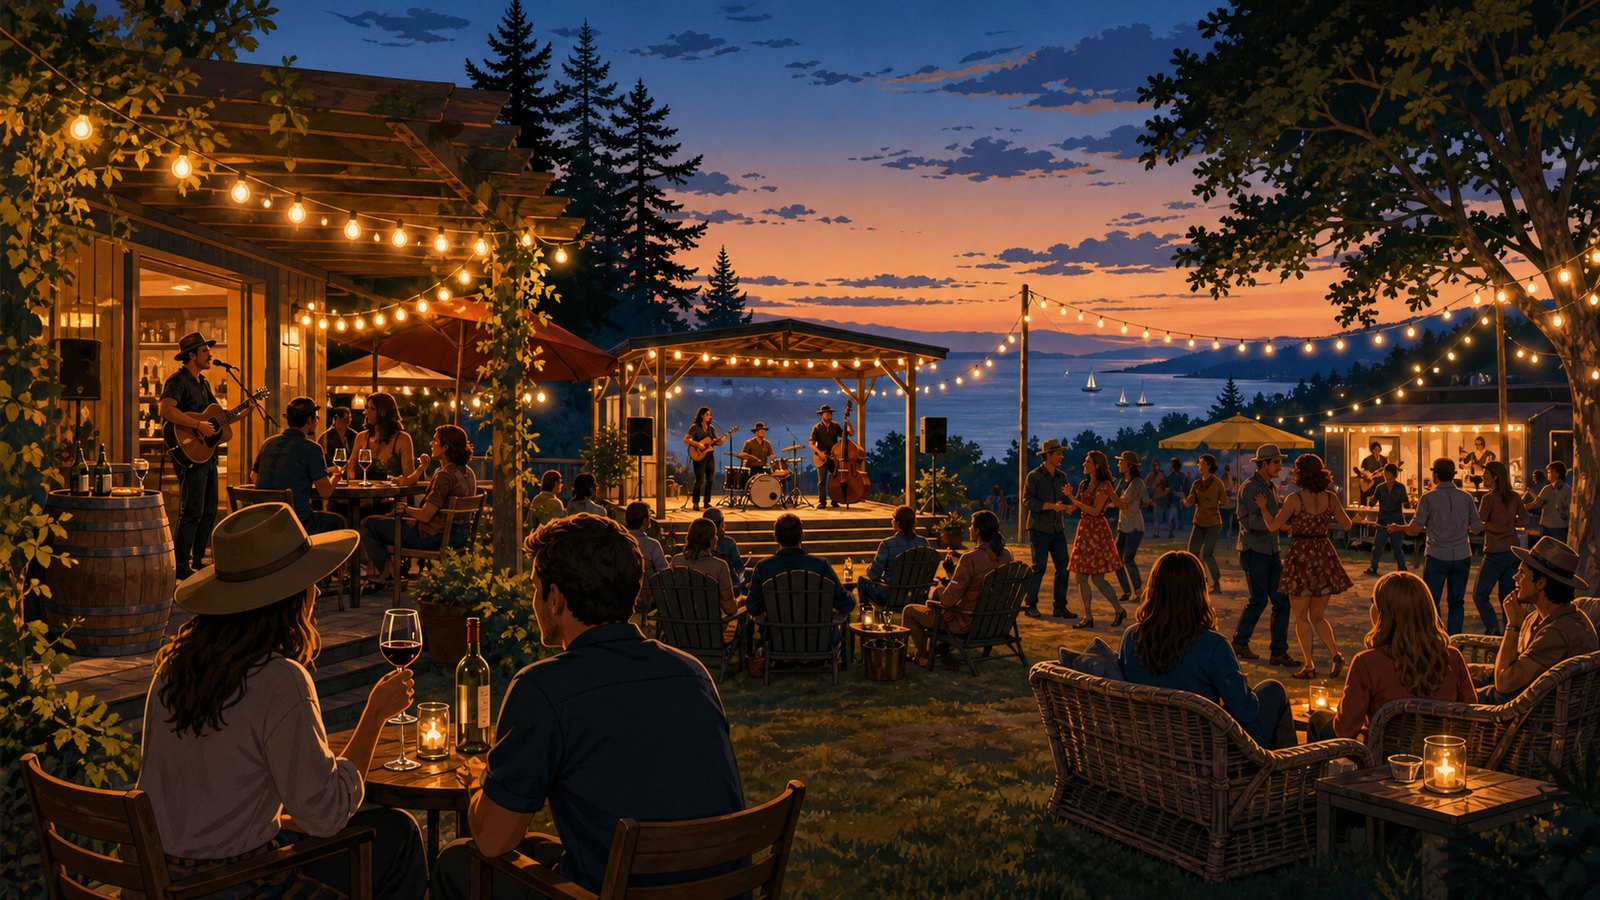
South Whidbey summer music guide
Why This Is A Very Whidbey Kind Of Summer Night
Bioluminescence kayaking works because it asks you to slow down. You have to wait for dark. You have to accept that nature decides how bright the show will be. You have to notice small movement in black water instead of chasing a big attraction.
That is part of why it belongs on Whidbey. The island’s best experiences often are not the loudest ones. Sometimes they are a quiet harbor, a patient guide, a paddle stroke, and a few seconds of light where you did not expect it.
FAQs About Whidbey Island Bioluminescence Kayaking
Can you see bioluminescence on Whidbey Island?
Yes, Whidbey Island Kayaking offers summer bioluminescence kayak experiences timed around darker new-moon periods when viewing conditions may be better. Conditions vary, so the glow should be treated as a natural phenomenon, not a guaranteed light show.
Do you need kayaking experience for a Whidbey bioluminescence tour?
The current Whidbey/Camano tourism listing describes the experience as beginner-friendly, with no previous experience needed and tandem kayaks. Still, anyone booking should be comfortable being on the water at night and should follow the guide’s instructions.
When are Whidbey bioluminescence kayak tours in 2026?
The current tourism listing shows selected June, July, August, and September 2026 dates, generally grouped around darker summer nights. Check Whidbey Island Kayaking’s booking page for the latest availability, price, and start time before making plans.
Where do Whidbey bioluminescence kayak tours leave from?
Whidbey Island Kayaking is closely tied to Langley and South Whidbey Harbor. Check your booking confirmation for the exact meeting location, because tour logistics can depend on weather, water conditions, and the specific experience booked.
What should you bring for a night kayak tour?
Bring warm layers, footwear that can get damp, and any required items listed by the operator, such as a headlamp. Avoid heavy alcohol before the tour so you can stay steady, alert, and able to follow guide instructions. Also plan for late-night transportation, ferry timing if needed, and a careful drive after the tour.
Written by Si Fisher.