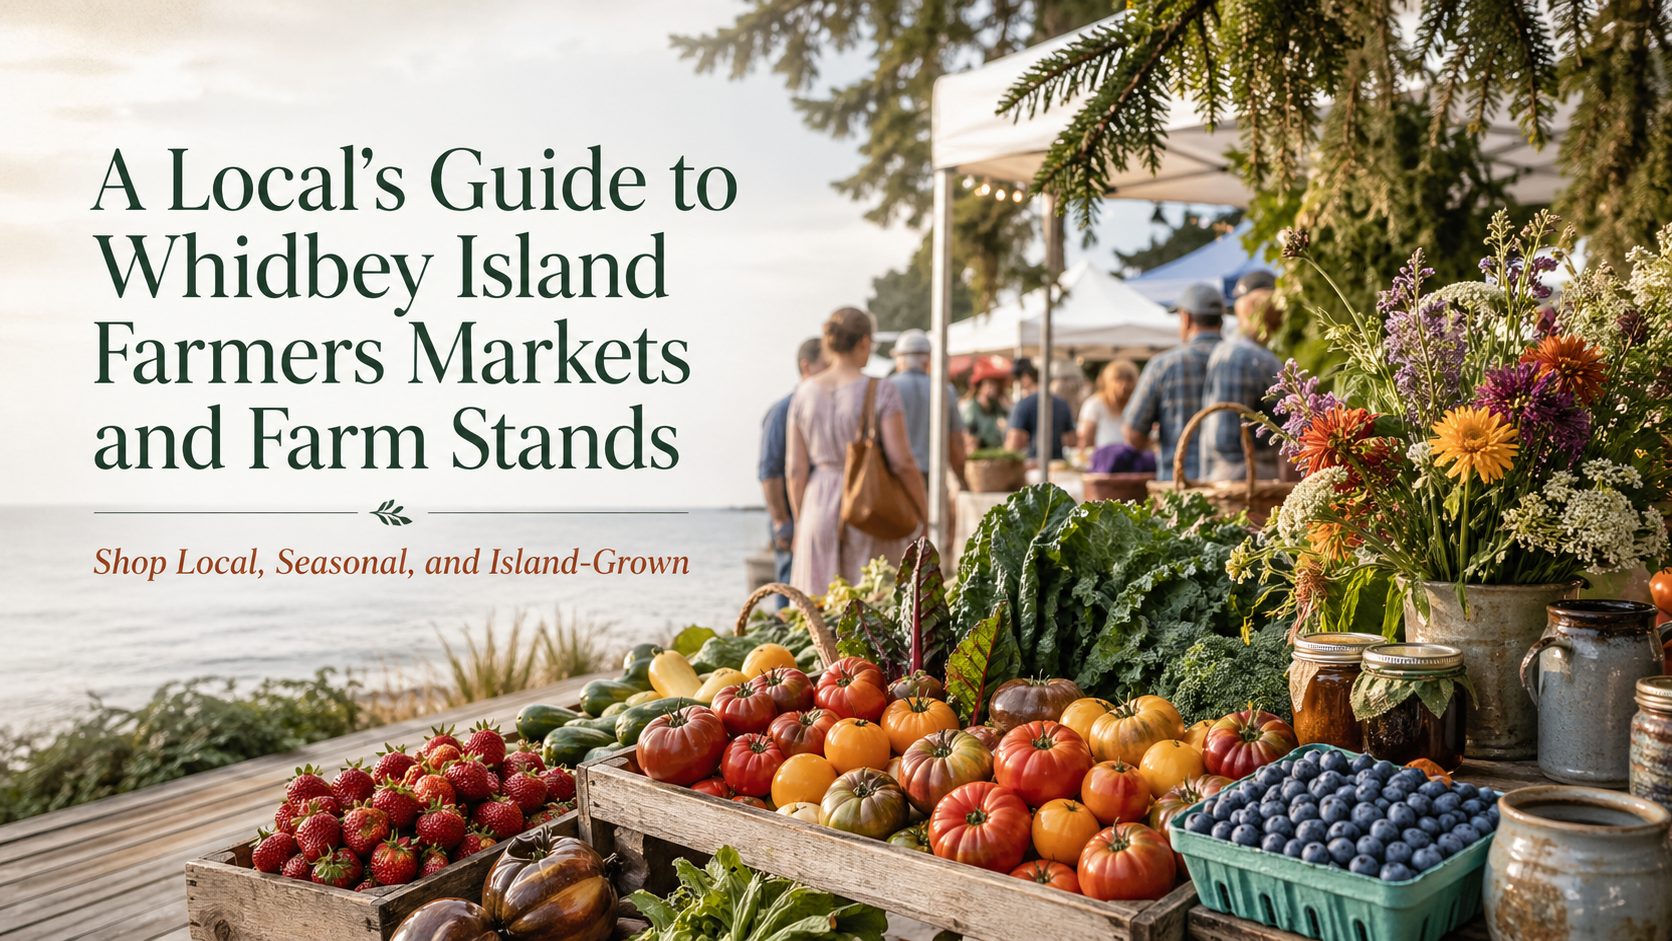
Hyperlocal Guide · Whidbey Island
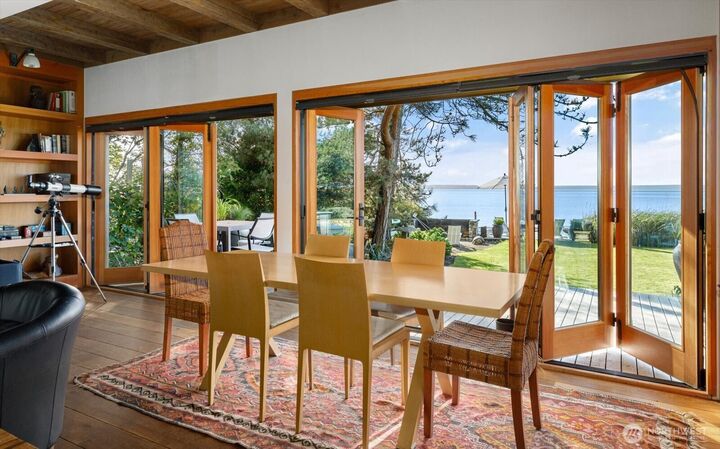
One of the best ways to understand Whidbey Island is to shop where islanders shop.
Farmers markets and farm stands reveal the everyday rhythm of island life: where people pick up berries, flowers, eggs, vegetables, honey, and small local finds that make Whidbey feel personal instead of generic. This guide is designed to help readers discover the island’s standout seasonal markets and the many farm stands that make local shopping part of the experience.
It also gives a deserved nod to WhidbeyFarmStands.com, a useful local resource that helps track these places in one directory. Read this guide first, then head over there and bookmark it for ongoing use.
Images in this article are figurative editorial representations designed to support the story and may not be direct on-site photographs of the specific people, places, businesses, or scenes discussed.
Quick Takeaways
Big Seasonal Markets
Bayview, Coupeville, Oak Harbor, and South Whidbey Tilth
Keep reading for the island’s biggest recurring market anchors.
Stand-by-Stand Guide
This article breaks out each farm stand individually
So readers can find specific places they are already searching for.
Useful Search Detail
Links, locations, dates, and what each stop is known for
A better fit for real search intent than a vague roundup.
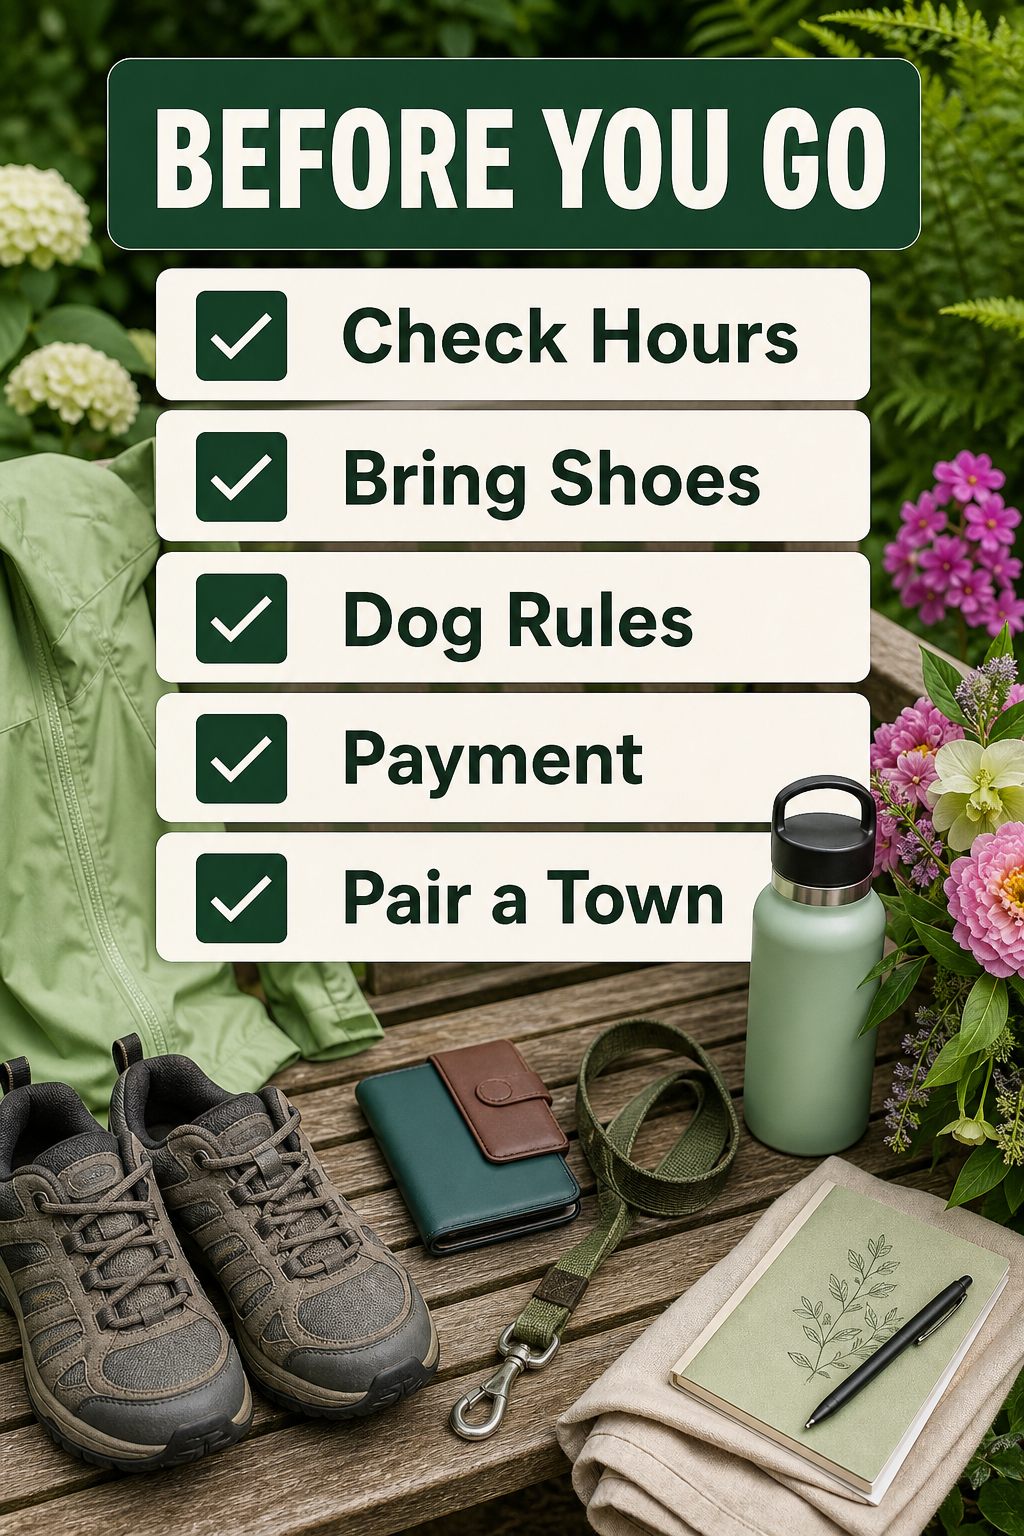
After You Read
Then bookmark WhidbeyFarmStands.com
Use it as the ongoing local directory after finishing the guide.
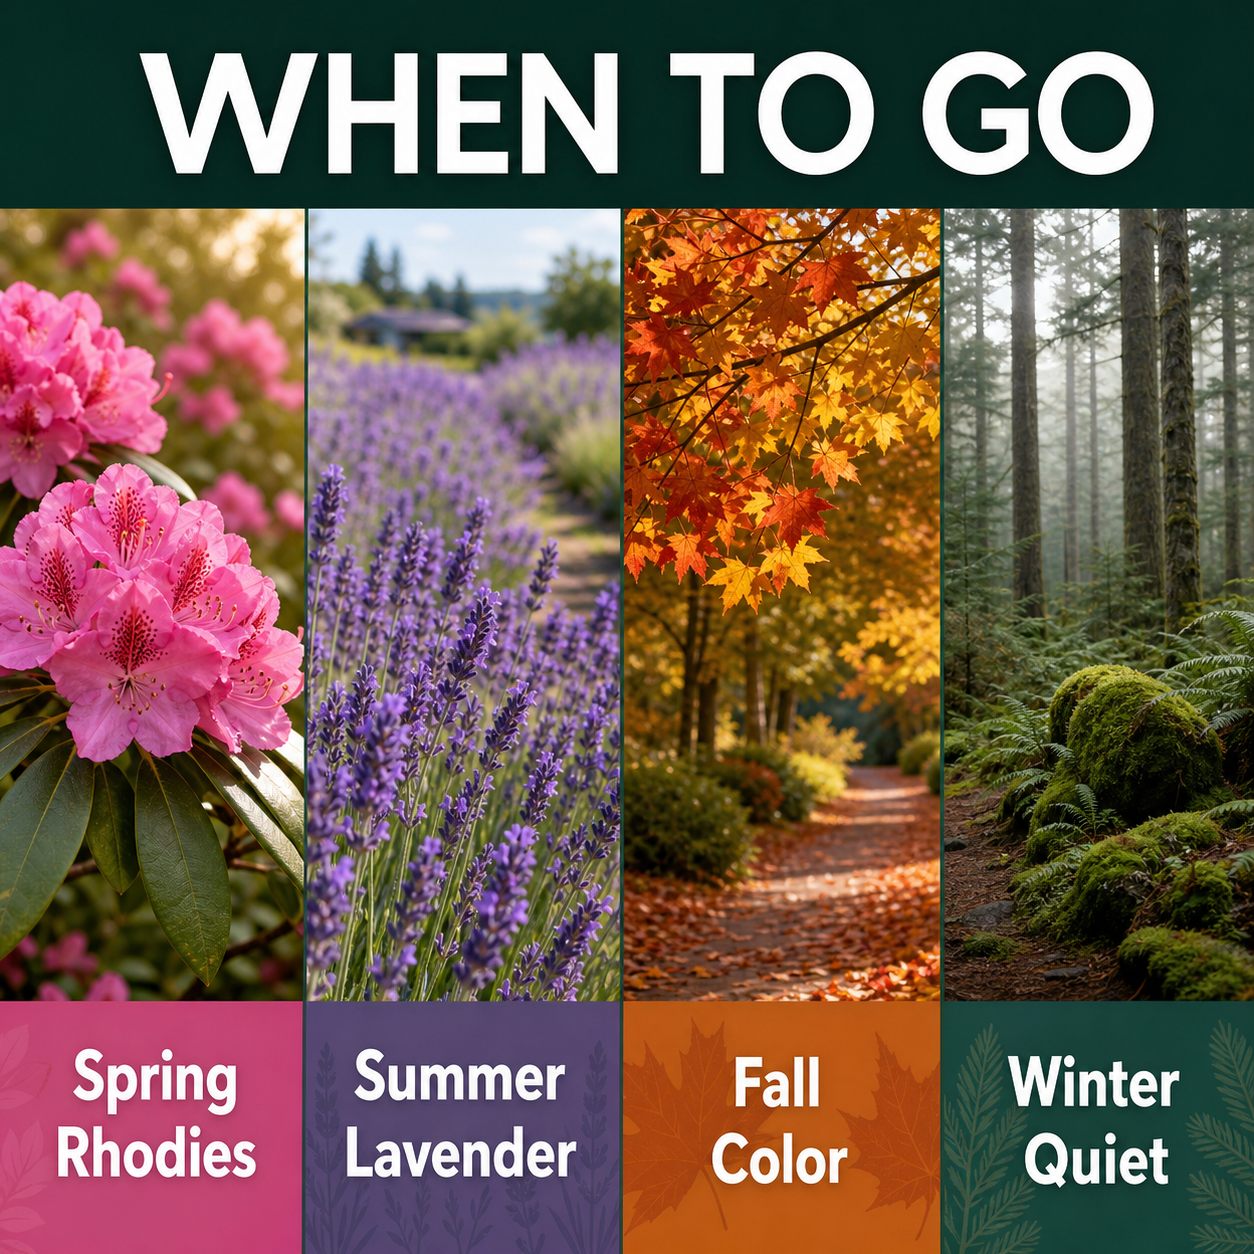
Whidbey Island Farmers Markets
If you want the broadest browse-and-discover experience, start with the island’s major farmers markets. These are the best places to find a mix of produce, flowers, prepared food, handmade goods, and local community energy all in one stop.
Bayview Farmers Market
Location: Bayview Farmers Market, Bayview Road, Langley
Season: April 25 – October 17, 2026
Hours: Saturdays, 10 AM – 2 PM
Learn more: Official website
Bayview Farmers Market is one of South Whidbey’s best-known market anchors and an easy first recommendation for anyone looking for a lively seasonal market with strong local character.
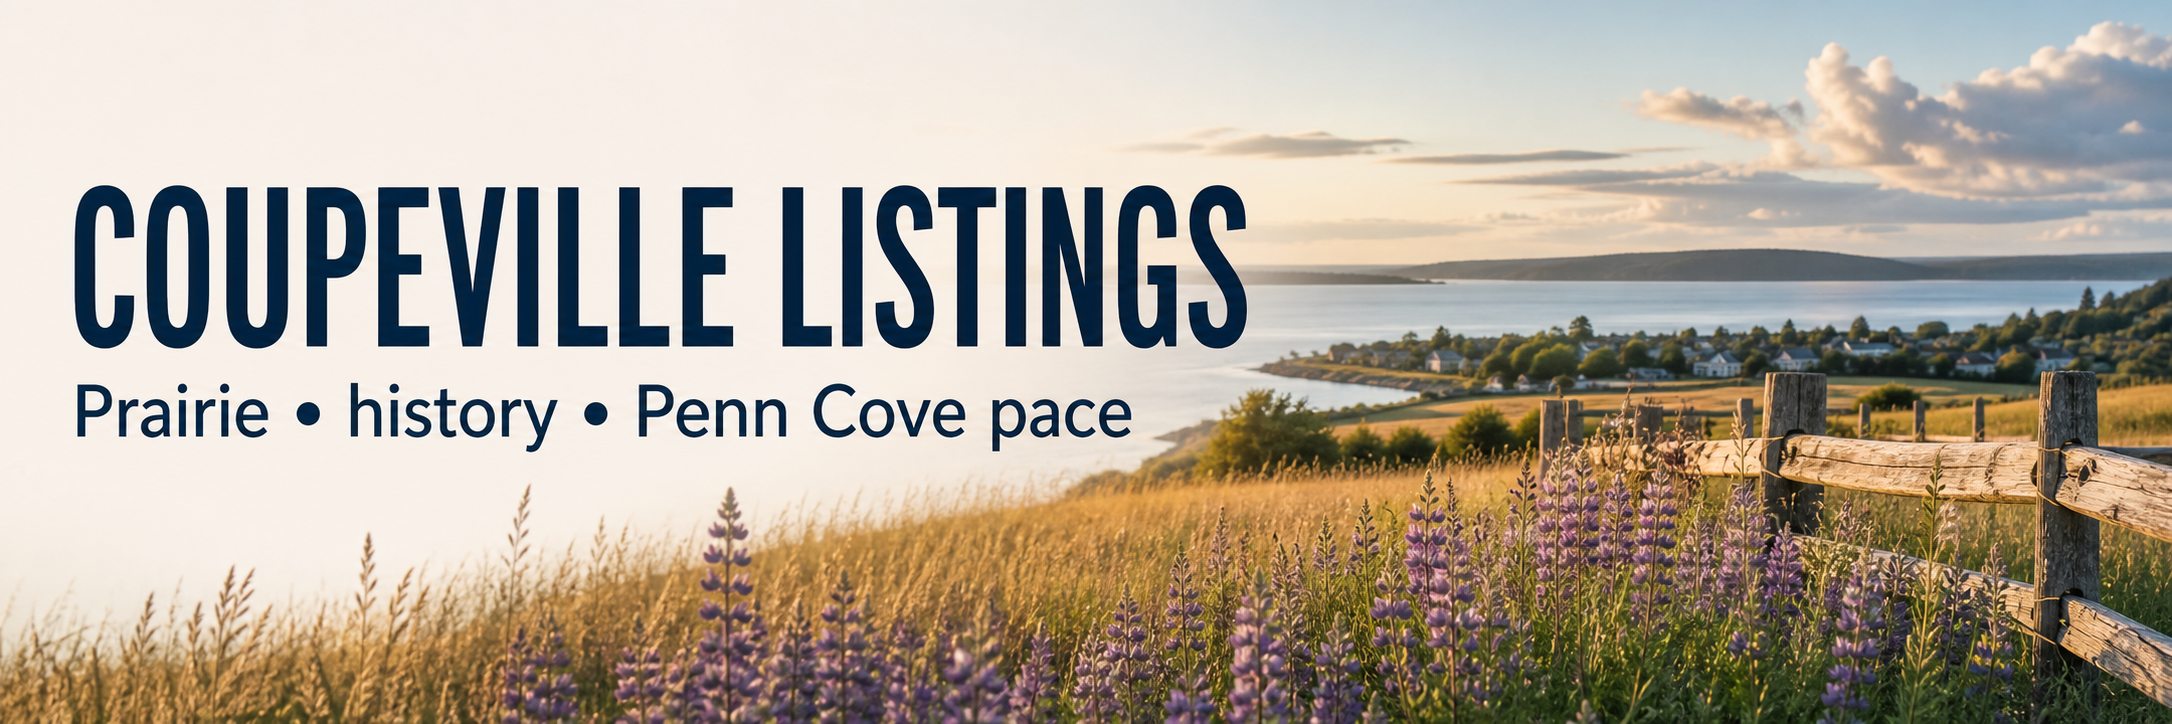
Coupeville Farmers Market
Location: Coupeville Farmers Market, Northwest Alexander Street, Coupeville
Season: April 18 – October 10
Hours: Saturdays, 10 AM – 2 PM
Learn more: Profile / market info
Held on the Coupeville green, this market pairs especially well with a day in town and gives central Whidbey shoppers an easy recurring seasonal stop.
Oak Harbor Farmers Market
Location: Oak Harbor Farmers Market, Rotary Park State Route 20, Oak Harbor
Season: May 7 – September 10
Hours: Thursdays, 4 PM – 7 PM
Learn more: Official website
Oak Harbor’s market gives North Whidbey shoppers a dedicated weekly market stop and broadens the island’s seasonal market rhythm beyond the weekend circuit.
South Whidbey Tilth Farmers Market
Location: 2812 Thompson Rd, Langley
Season: Sundays, May 3 – October 18, 2026
Hours: 11 AM – 3 PM
Learn more: Official market page
This market adds a strong community-centered South Whidbey option with local produce, flowers, gifts, hot food, music, and family-friendly amenities.
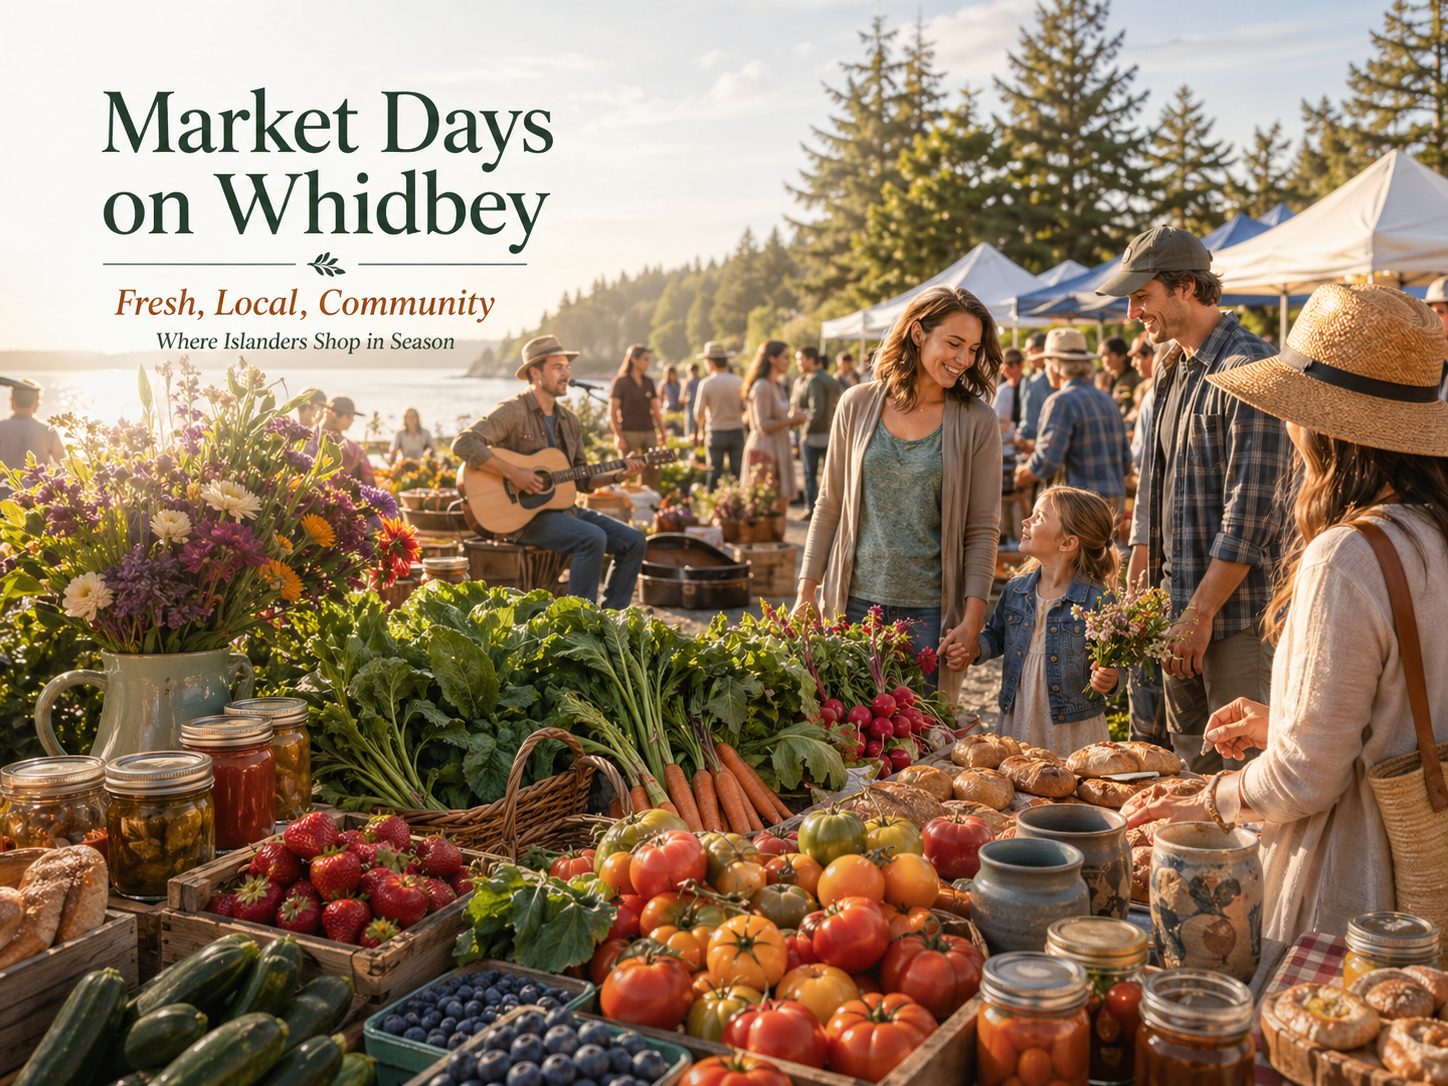
Why These Markets Matter
For many locals and future buyers, markets are not just shopping stops. They are one of the clearest windows into the island’s weekly rhythm, local priorities, and small-community feel.
That is part of why specific market names matter for search — and for real local usefulness.
Whidbey Island Farm Stands
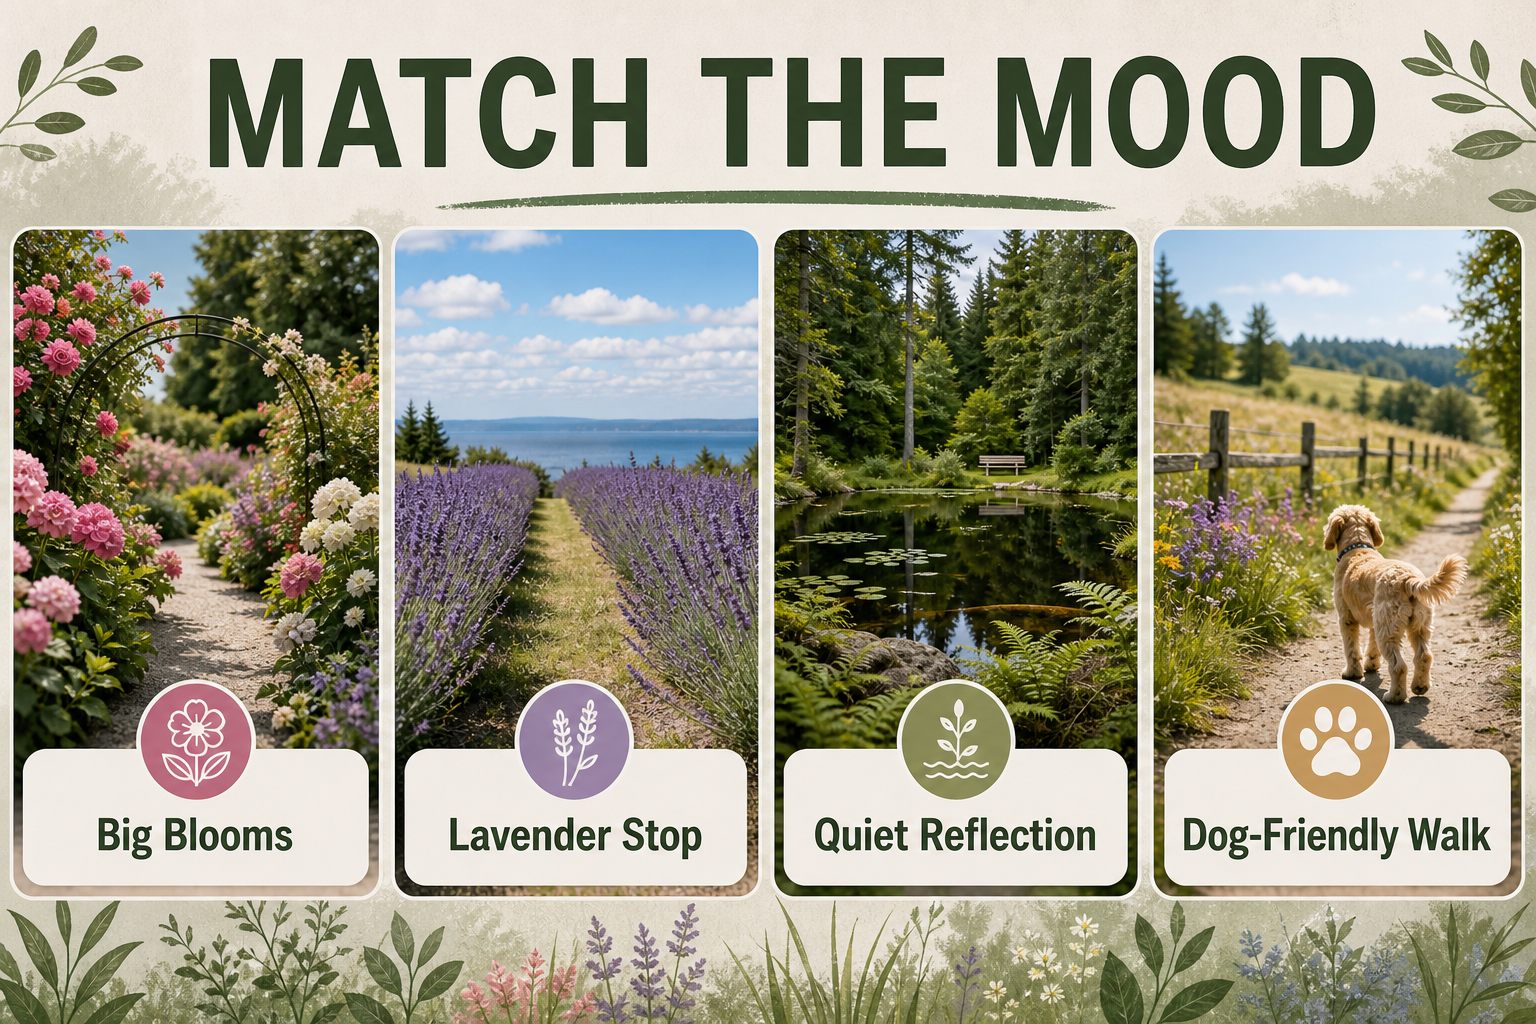
Beyond the larger markets, Whidbey’s farm-stand culture is where local shopping becomes more personal. These stops range from all-year farm stores to seasonal honesty stands and flower stands, each with its own specialty and rhythm.
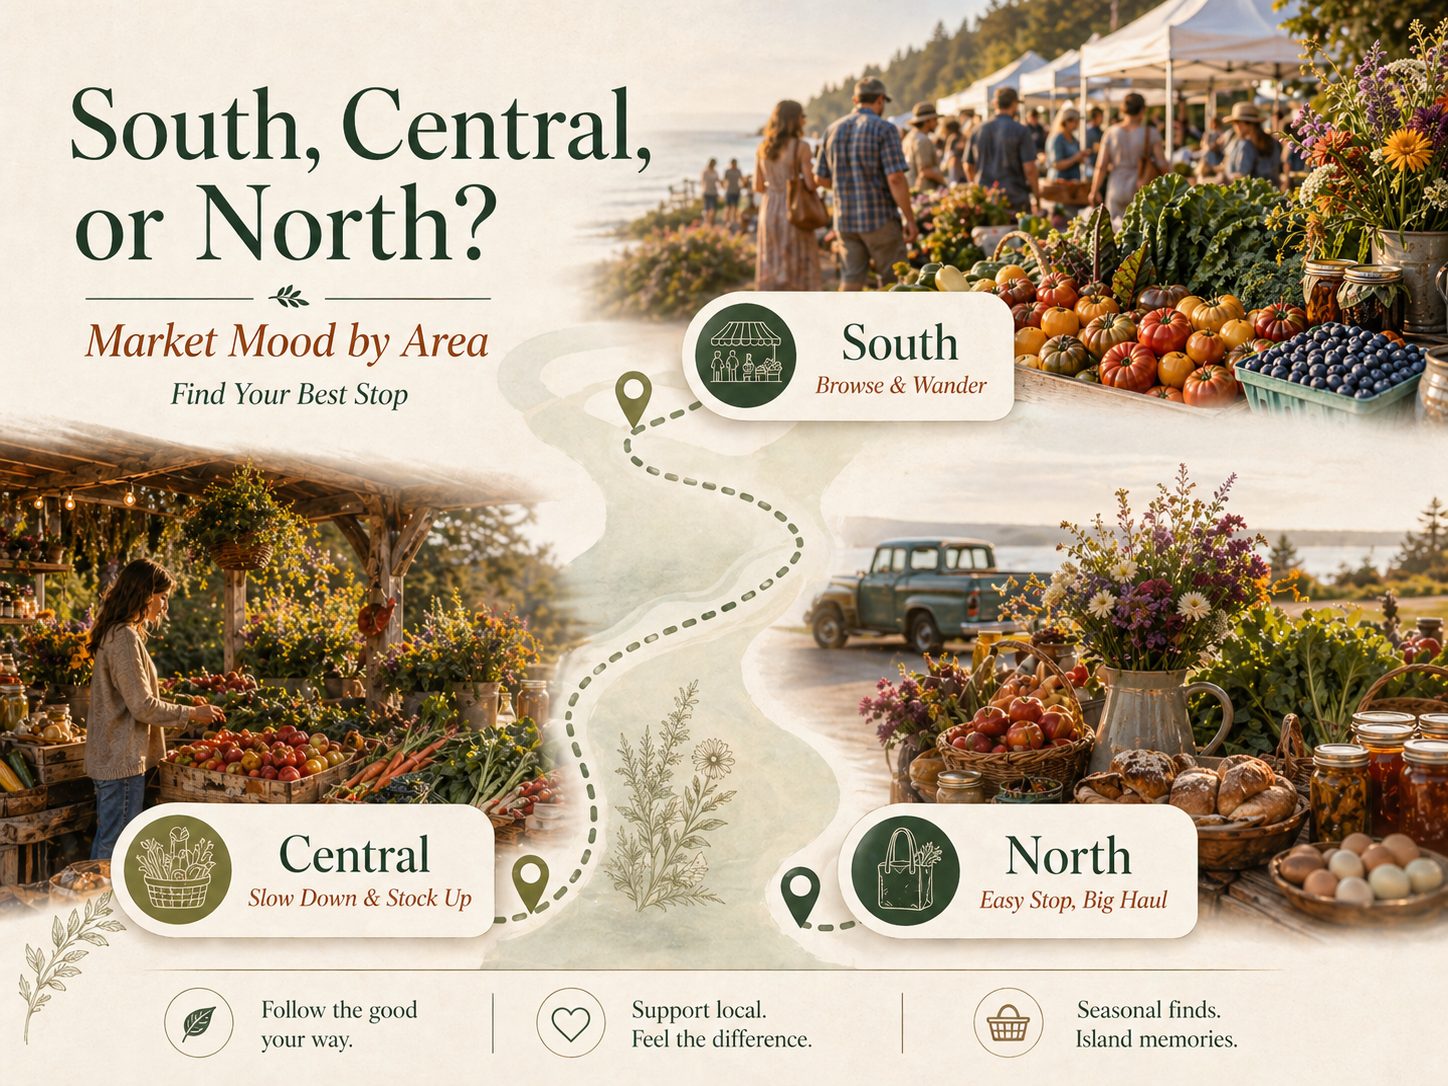
To make this easier to scan, the farm stands below are grouped loosely by area. That helps readers find a stop near where they already are, while still giving each stand its own searchable section.
Coupeville / Central Whidbey Farm Stands
3 Sisters Market
Location: 779 Holbrook Rd, Coupeville
Open: All year
Hours: 7 days a week, 9 AM – 6 PM
Learn more: Official website
Known for beef, pork, lamb, chicken, eggs, dairy, produce, local gifts, and gluten-free baked goods.
Bell’s Farm
Location: 892 W Beach Rd, Coupeville
Open: Daily
Hours: 8 AM – 6 PM
Learn more: Official website
A regenerative-practices honesty stand with pasture-raised lamb and beef, plus flowers and herbs.
South Whidbey Farm Stands
Canfield Orchard Farmstand
Location: 4968 Canfield Lane, Langley
Open: Year-round
Hours: Dawn to dusk
A quieter South Whidbey stop for seasonal fruits and vegetables, especially useful for readers looking for simple local produce access without a full market setting.
North Whidbey Farm Stands
Case Farm
Location: 98 Case Road, Oak Harbor
Season: May – October
Hours: 10 AM – 7 PM
Learn more: Official website
Known for tomato and veggie starts, eggs, seasonal produce, and a fall pumpkin patch, with deep North Whidbey family-farm roots.
Fainting Goat Farms & Whidbey Island Honey
Location: 5515 Coles Road, Langley
Open: Year-round
Hours: Daily, daylight hours
Learn more: Official website
Known for Whidbey Island Honey, flowers, eggs, fruit, vegetables, honey, and beeswax candles.
Flight Path Farmstead
Location: 5662 Crawford Road, Langley
Season: April – November
Hours: Daylight hours
Offers assorted fruits and vegetables, berries, and chicken and quail eggs in a smaller-scale stand format that feels rooted in everyday local shopping.
Foggy Hill Farm
Location: 5623 Double Bluff Road, Langley
Season: Mid March – mid December
Hours: 7 days a week, 8 AM – 8 PM
Learn more: Official website
Produce, cut flowers, and herbs in a strong South Whidbey location.
Forget Me Not Farms
Location: 5700 Double Bluff Rd, Freeland
Season: Mid-March through October
Hours: Daily, dawn to dusk
Learn more: Official website
Naturally grown flowers, berries, and vegetables.
Foxtail Farm
Location: Bush Point Road between Shore Meadow Rd and Kemp Lane
Open: All year
Hours: Summer 9 AM – 6 PM; Winter 10 AM – 5 PM
Learn more: Official website
Certified organic vegetables, herbs, berries, and cut flowers.
Full Cycle Farm
Location: Corner of Quade and Maxwelton Roads, Clinton
Season: March – December
Hours: Daily, dawn to dusk
Learn more: Official website
Fresh vegetables, fruit, flowers, trees, wreaths, and plants.
Glendale Shepherd
Location: 7616 Glendale Heights Rd, Clinton
Open: Daily, year-round
Hours: 11 AM – 4 PM
Learn more: Official website
Known for sheep cheeses, yogurt, seasonal lamb, and its new Wheyfarer tasting room.
High Family Farms
Location: 279 E Fakkema Rd, Oak Harbor
Open: Year-round
Hours: Daily
Learn more: Profile
Chicken eggs, duck eggs, and seasonal produce make this a straightforward North Whidbey option for staple local-food stops.
Huckleberry Hill Homestead
Location: 5310 Crawford Rd, Langley
Season: June – October
Hours: Tuesday – Friday, 8 AM – 5 PM
Learn more: Profile
Fruits, vegetables, preserves, honey, eggs, and native plants.
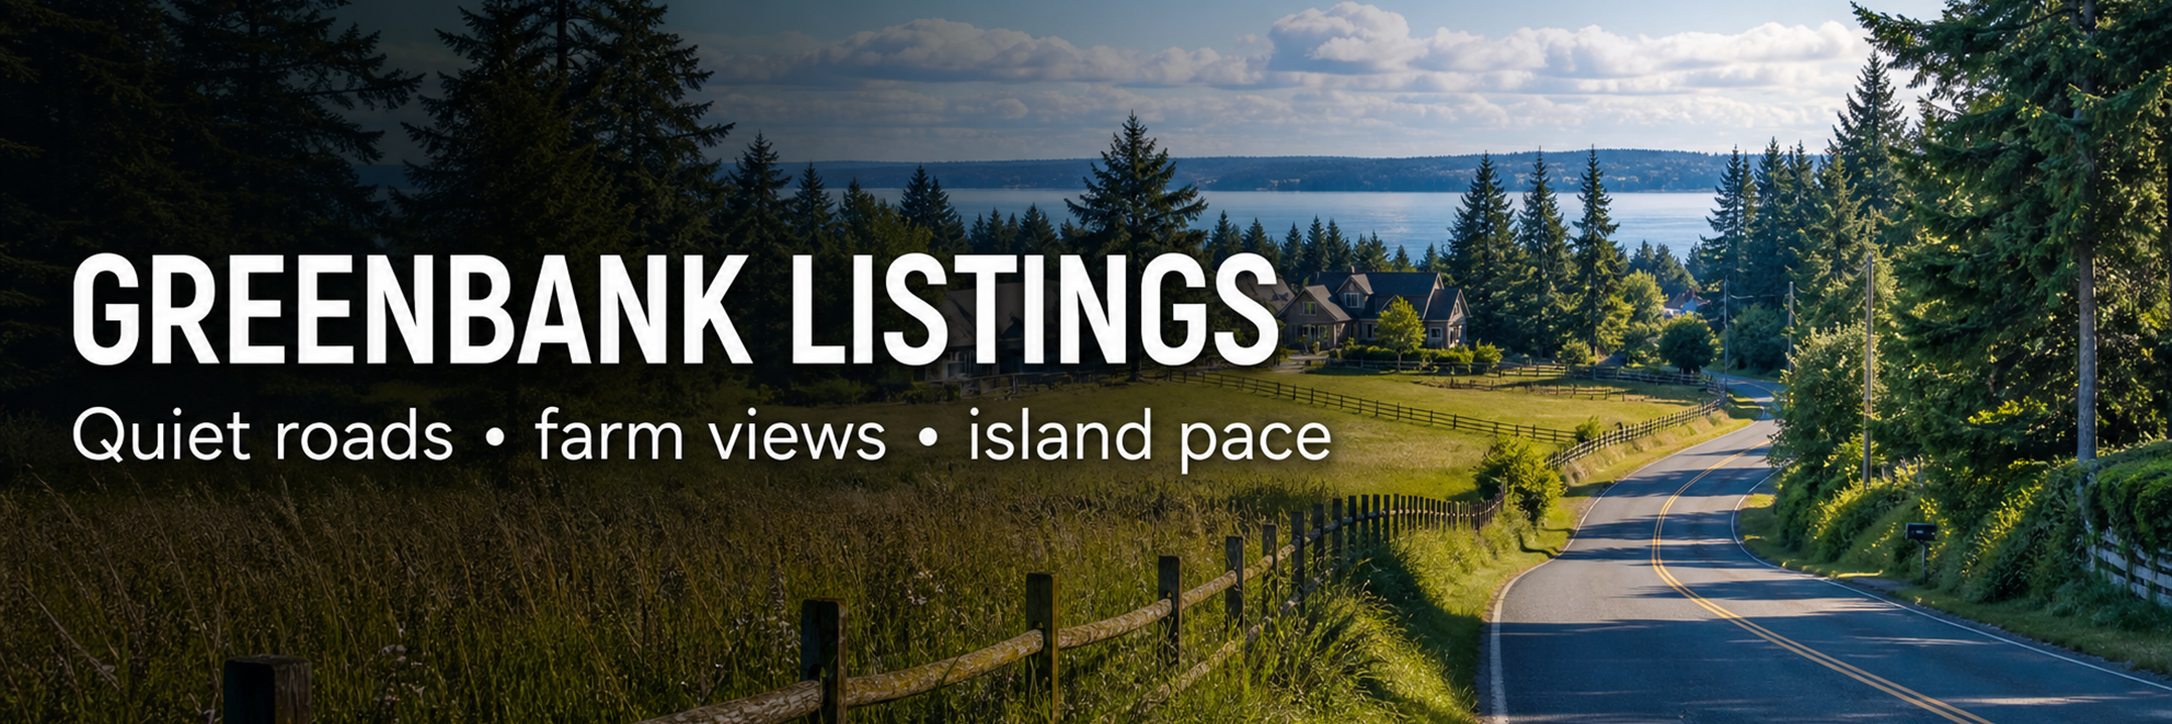
Island Seed
Location: 765 Classic Rd, Greenbank
Season: April – September
Hours: 10 AM – 6 PM
Learn more: Profile
Vibrant flower bouquets, fresh eggs, plant starts, and seedlings give this Greenbank stop a strong spring-and-summer appeal.
K and R Farms
Location: 36699 State Route 20, Oak Harbor
Season: April 1 – October 31
Hours: 7 days a week, 11 AM – 6 PM
Learn more: Official website
A classic larger stop for strawberries, pumpkins, honey, beef, corn, vegetables, flowers, berries, and gourmet ice cream.
Loghouse Flowers
Location: 6653 Maxwelton Road, Clinton
Season: May – October
Hours: 24 hours
Learn more: Profile
Farm-grown flowers in vases with simple self-serve convenience make this a charming stop for seasonal color rather than a full produce run.
Muscle and Arm Farm
Location: 21910 State Route 525, Freeland
Season: Seasonal
Hours: Honor stand open 24/7
Learn more: Official website
Known for heritage fruit trees, plant starts, and seasonal fruit offerings.
Mutiny Bay Blues
Location: 5486 Cameron Road, Freeland
Open: Year-round
Hours: Farm store Thursday – Saturday, 9 AM – 1 PM
Learn more: Official website
Organic blueberries, mushrooms, eggs, granola, and more from a recognizable South Whidbey stop.
Nettle Forest Farm
Location: 6215 Wahl Rd, Freeland
Season: Seasonal
Hours: Friday & Sunday
Learn more: Official website
Organic vegetables, berries, eggs, fruit, herbs, and flowers.
Nutty Goat Farm
Location: 28 E Fakkema Rd, Oak Harbor
Season: Friday – Sunday
Hours: Self-serve
Learn more: Official website
Eggs, honey, plant starts, seasonal produce, flowers, soaps, and baked goods.
Ohana`Re Farms
Location: 4293 Welcome Road, Langley
Season: April – November
Hours: Honesty stand
All-natural farm eggs, plant starts, fruit, and vegetables in season give this Langley-area honesty stand a practical local-neighborhood feel.
One Willow Farm
Location: 29332 Washington 20, Oak Harbor
Season: April – October
Hours: Wednesday – Sunday, dawn to dusk
Learn more: Official website
The Old Yellow Truck farm stand offers eggs, flowers, seasonal vegetables, and microgreens.
Orchard Kitchen Farm Stand
Location: 5574 Bayview Road, Langley
Season: Spring through end of October
Hours: Wednesday – Saturday, noon to dusk
Learn more: Official website
Organic-practice vegetables, flowers, and a respected South Whidbey stop for fresh produce.
Organic Farm School
Location: 6390 Maxwelton Road, Clinton
Open: Year-round
Hours: Daylight
Learn more: Official website
A regenerative learning center with seasonal organic vegetables and pasture-raised eggs, plus deeper community value through its educational mission.
Owl Haven Produce
Location: 1495 Arnold Road, Oak Harbor
Season: June – December
Hours: Daylight hours
Potatoes and other seasonal produce grown with natural farming practices make this a useful North Whidbey self-serve stop for simple farm-stand shopping.
Specialty / Seasonal Farm Stops
Pacific Rim Institute
Location: 180 Parker Road, Coupeville
Open: Year-round
Hours: Weekdays 9 AM – 4 PM; drop in or call for appointment
Learn more: Official website
A more specialized stop for native plants and landscape-focused local gardening value.
Petry Farm Stand
Location: 3117 Poor Rd, Greenbank
Season: Seasonal
Hours: Daily
Perennial flowers, herbs, fresh cut flowers, and produce when available make this a nice fit for readers searching more for garden beauty and seasonal color than a large market haul.
Prairie Bottom Farm
Location: 293 Engle Rd, Coupeville
Season: May – October
Hours: Thursday – Saturday, 12 PM – 6 PM
Learn more: Official website
Eggs, vegetables, dry beans, herbs, berries, flowers, and locally roasted organic coffee.
Scenic Isle Farm
Location: 46 S Ebey Rd, Coupeville
Season: October 1 – 31
Hours: Daily, trolley rides on weekends 10 AM – 5 PM
Learn more: Official website
A seasonal pumpkin-patch tradition with family appeal and heirloom squash grown without synthetic chemicals or sprays.
Silva Family Farms
Location: 29279 SR 20, Oak Harbor
Season: June – October
Hours: Vary
Learn more: Official website
Known for strawberries, raspberries, blackberries, and blueberries.
South Whidbey School Farm Stand
Location: 5675 Maxwelton Rd, Langley
Season: April through December
Hours: All hours, self-serve
Learn more: Official website
Student-grown produce and flowers, including greens, root vegetables, starts, squash, and more when in season.
South Whidbey Tilth Farm Stand
Location: 2812 Thompson Road, Langley
Open: Year-round; check for open sign; closed during Sunday market
Hours: Dawn to dusk
Learn more: Official farm stand page
Eggs, flowers, vegetables, berries, apples, and plant starts with practical payment options and SNAP access on select days.
The Cheeky Chicks Farmstand
Location: 753 Southwest Thornberry Drive, Oak Harbor
Season: March – October
Hours: 7 AM – 7 PM
Learn more: Profile
Eggs, berries, and vegetables in a straightforward local stand format make this a simple, highly practical North Whidbey stop.
Tiller’s Farm and Garden
Location: 2133 Lancaster Road, Freeland
Season: Mid-June – Mid-December
Hours: Daily, 8 AM – 8 PM
Learn more: Official website
Vegetables, fruits, plant starts, bouquets, U-pick flowers, and farm-stay appeal.
Western Sun Lavender Farm
Location: 2530 Darst Road, Coupeville
Season: Mid June – end of August
Hours: Wednesday – Sunday, 9 AM – 5 PM
Learn more: Official website
Fresh and dried lavender offerings, essential oil, hydrosol, and related seasonal farm products.
Whidbey Farm and Market
Location: 1422 Monroe Landing Road, Oak Harbor
Season: May – October
Hours: Friday – Sunday, 11 AM – 6 PM; open until 10 PM Fridays and Saturdays in October
Learn more: Official website
A larger destination-style stop with produce, pasture-raised meats, coffee, gifts, ice cream, and strong fall family attractions.
Woodsong Family Farm
Location: 7800 Mortland Drive, Clinton
Season: May 1 – October 1
Hours: Thursday – Sunday, 10 AM – 5 PM
Learn more: Official website
Pasture-raised pork, eggs, seasonal produce, and flowers.
A Different Kind of Whidbey Rhythm
What makes these stops memorable is not only what they sell. It is the feeling of buying from places that still reflect the island’s agricultural and community character.
That local rhythm is exactly why people search for these specific stands by name — and why this article should help them find them.
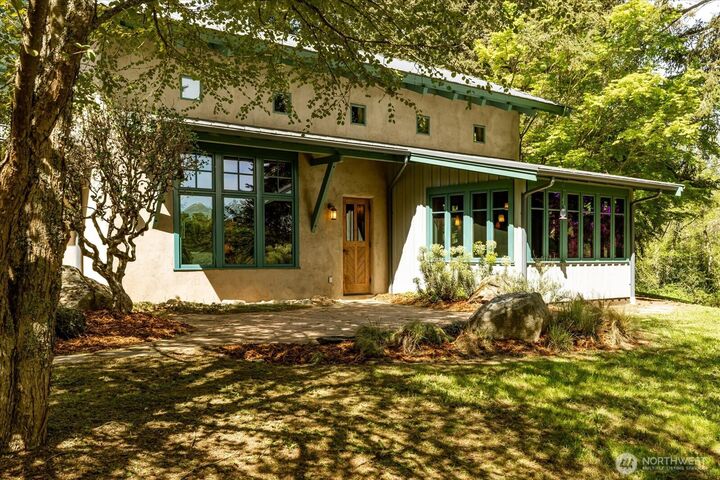
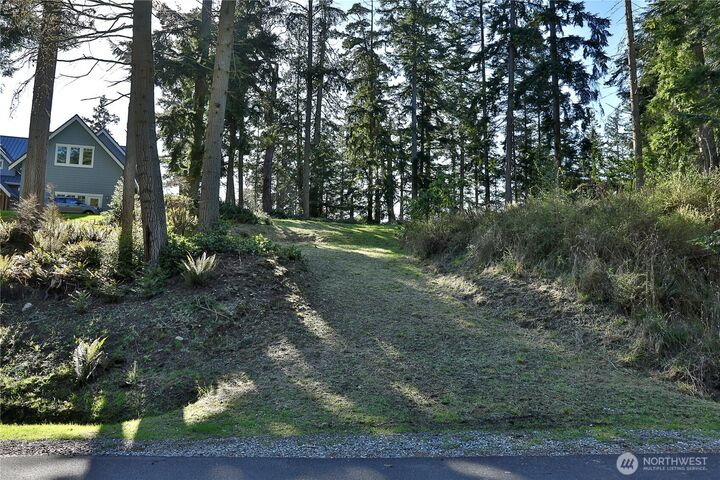
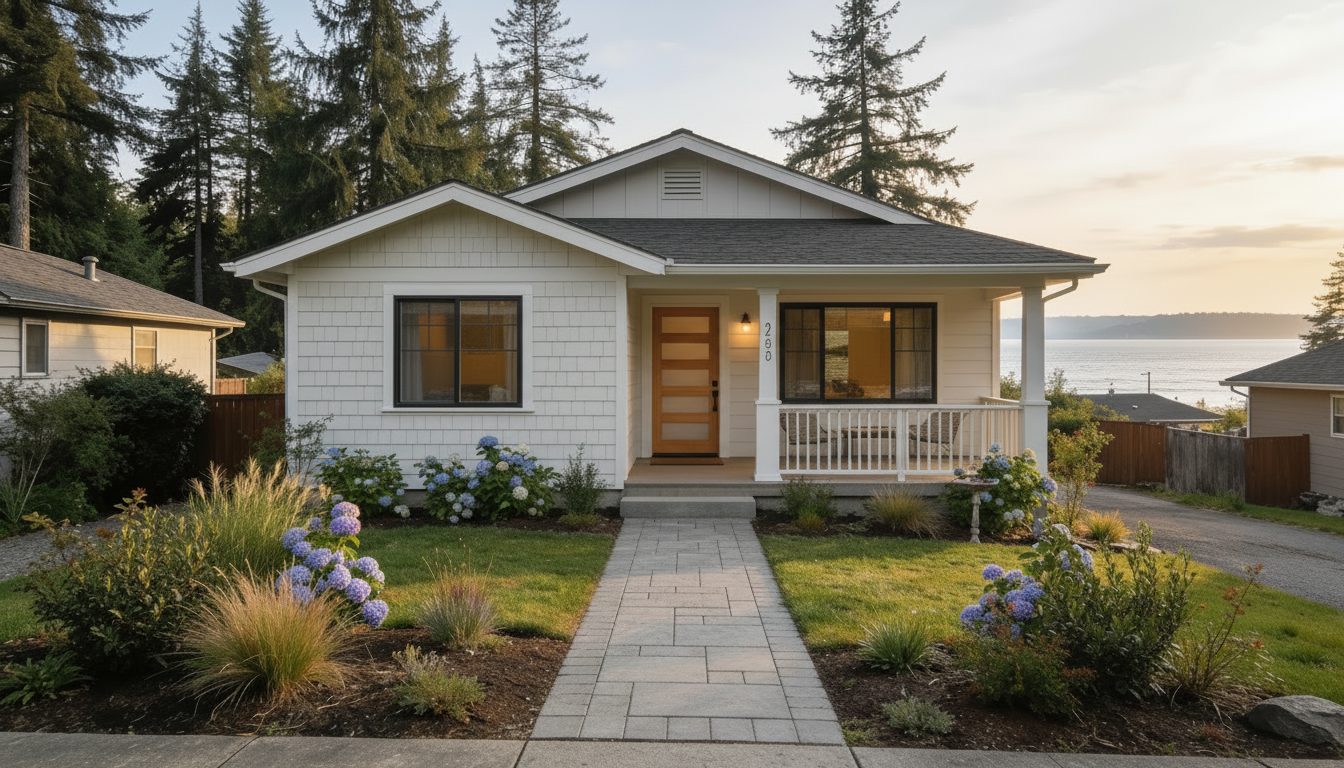
Why This Matters to Future Whidbey Buyers Too
For many future buyers, guides like this are about more than a shopping errand. They show what everyday life feels like on the island. A place becomes more real when you know where to get eggs, flowers, berries, produce, lavender, honey, or a Saturday market routine that feels like your own.
The Search Intent Is Real
People do search for these places by name. Bayview Farmers Market. K and R Farms. South Whidbey Tilth. Orchard Kitchen Farm Stand. A good local article should help them find those specific places, not just speak in broad lifestyle generalities.
That is what makes this updated structure stronger.
Frequently Asked Questions
What are the biggest Whidbey Island farmers markets?
Some of the biggest and best-known recurring options include Bayview Farmers Market, Coupeville Farmers Market, Oak Harbor Farmers Market, and South Whidbey Tilth Farmers Market.
When do Whidbey Island farmers markets open?
Most of the major seasonal markets begin in spring and run into fall, but dates vary by market. This guide includes current timing details for Bayview, Coupeville, Oak Harbor, and South Whidbey Tilth based on the latest source information used for this article.
Which Whidbey farm stands are open year-round?
Several stands in this guide present themselves as year-round or all-year options, including places such as 3 Sisters Market, Foxtail Farm, Glendale Shepherd, Organic Farm School, and South Whidbey Tilth Farm Stand, though shoppers should still check current hours before visiting.
Where can I buy eggs, flowers, berries, or produce on Whidbey Island?
That depends on what you want. Some stands lean toward eggs and vegetables, others toward flowers, berries, honey, lavender, or seasonal fruit. This guide is structured so readers can scan specific farm names and specialties instead of sorting through a vague general roundup.
Written by Si Fisher
 Facebook
 X
X
 Pinterest
 Copy Link


 Given all the factors discussed above, the needle stays in the same position as the last quarter. The market still heavily favors sellers, but if rates rise much further, headwinds will likely increase.