In this market, the answer is often yes. Not always. Not automatically. But if the goal is to get a qualified buyer across the finish line, a closing-cost credit can do more work than a price reduction.
The short version: With mortgage rates still weighing on buyer budgets, helping with cash-to-close may be more powerful than shaving the same amount off the list price.
A recent Keeping Current Matters article raised the national version of this question. But Whidbey is not a national average with ferry access. Our market is local, segmented, and occasionally a little dramatic in the way only island real estate can be.
For Whidbey sellers, the better question is not, “Am I giving something away?” It is, “Which move helps the buyer enough to get the deal done while still protecting my net?”
Seller concessions are already part of the South Whidbey market
This is not some strange new negotiation creature wandering out of the woods. According to NWMLS data provided for area 811 - South Whidbey, 45 of 126 residential and condo listings that closed in the 180 days ending June 15, 2026 included seller concessions.
36%
of recent South Whidbey closings included seller concessions
That means seller help with buyer costs is not rare. It is showing up in roughly one out of three recent South Whidbey residential and condo closings. The details still matter, but the strategy is clearly on the table.
Why a credit can beat a price reduction
A price reduction can look satisfying on paper. It is clean, visible, and easy to understand. But for a buyer dealing with today’s mortgage rates, the monthly payment change from a modest price cut may not feel big enough to solve the actual problem.
Buyer closing costs are different. A seller credit can reduce the cash a buyer needs at closing. That can be the difference between “we like the house” and “we can actually buy the house.” Very technical real estate term: useful.
A credit is not a giveaway. It is a net-sheet decision.
If a $10,000 price reduction does not move the buyer’s payment enough to matter, but a $10,000 credit helps them cover closing costs, the credit may be the stronger negotiating tool.
The seller still needs to look at net proceeds, loan rules, appraisal risk, competing offers, and overall deal strength. But emotionally resisting the word “credit” can cost a seller a perfectly workable sale.
Why this is especially relevant on Whidbey
Whidbey is not one market. South Whidbey, Central Whidbey, and North Whidbey can behave differently at the same time. Waterfront, acreage, in-town homes, condos, view properties, and homes needing work can all draw different buyer pools.
That is why a blanket rule does not work. In one segment, a seller may need to create breathing room for the buyer. In another, a well-priced home in excellent condition may still have enough demand to hold firm.
The best strategy is not “always offer closing costs.” The best strategy is knowing when a credit solves the buyer’s real problem better than a price cut does.
When offering closing costs may make sense
A seller-paid closing-cost credit may be worth considering when showings are happening but offers are thin, buyers are giving positive feedback but hesitating on affordability, competing listings are sitting, or inspection and repair conversations are becoming deal friction.
It can also be useful when the home is priced correctly but the buyer pool is payment-sensitive. That is a very real thing right now. Buyers may like the house, like the location, and still feel squeezed by the amount of cash needed to close.
When sellers may want to hold firm
Some homes do not need to lead with a credit. If the listing is fresh, priced well, beautifully prepared, and getting strong activity, offering concessions too early can be like bringing a casserole to a dinner party that already has too much food. Kind, but maybe unnecessary.
In stronger segments, it may be better to wait for buyer feedback before adjusting the strategy. The question is not whether sellers should be flexible. The question is whether flexibility is solving a real market problem.
The practical seller test
Before choosing a price reduction or a closing-cost credit, sellers should ask four questions: What is the current showing activity? What are buyers saying? What similar homes are competing with us right now? And what does each option do to our net proceeds?
If a closing-cost credit helps the buyer more than a price reduction and keeps the seller’s net in an acceptable range, it may be the cleaner path to a sale. Not flashier. Not more dramatic. Just more effective.
FAQ
Should Whidbey sellers pay buyer closing costs right now?
In many cases, yes, especially when the buyer is qualified but stretched by cash-to-close. A seller credit can remove more friction than a small price reduction, but the right move depends on price point, condition, location, competing listings, and the seller's net proceeds.
How common are seller concessions on South Whidbey?
NWMLS data provided for 811 - South Whidbey shows that 45 of 126 residential and condo listings closed with seller concessions in the 180 days ending June 15, 2026, or about 36%.
Is a seller credit better than a price reduction?
Sometimes. A price reduction may only modestly change a buyer's monthly payment, while a closing-cost credit can directly reduce the cash a buyer needs to close. That can matter a lot in a higher-rate market.
Should every seller offer closing costs upfront?
No. Strong listings with excellent condition, pricing, location, and early activity may not need to offer a credit upfront. The strategy should be based on feedback, showing activity, competition, and the seller's goals.
Local real estate conditions vary by price segment, property type, condition, location, financing, and micro-market. Seller concessions, price reductions, and negotiation strategies should be evaluated with a local expert and a clear net sheet. NWMLS concession data referenced above was provided for South Whidbey residential and condo closings in the 180 days ending June 15, 2026.
Whidbey Island Real Estate Market Update: May 2026
Whidbey's market shifted in May, but not in the tidy, spreadsheet-friendly way that makes everyone nod and move on. Some buyers got more choices. Some sellers still had leverage. Some price bands perked up. Others hit the snooze button and asked for five more minutes.
The useful story is local and uneven: South Whidbey, Central Whidbey, and North Whidbey are not wearing the same outfit to this market. If you are buying or selling, the islandwide average is a starting point, not a strategy.
The short version: Central Whidbey gained the clearest inventory breathing room, South Whidbey stayed more balanced than dramatic, and North Whidbey remained active but more selective than last year.
May 2026 Snapshot: Pick a Metric
Animated local comparison by Whidbey submarket. Hover for exact values.
20262025
Inventory
Inventory is opening unevenly
South Whidbey ended May with 120 active residential and condo listings, slightly below 124 at the same point last year. That is not a flood of inventory. It is more like someone cracked a window and let a little air in.
Central Whidbey is where the inventory story gets louder. Active listings rose 43.6% year over year, from 39 to 56. New listings were up too, and pendings rose alongside them. Translation: buyers saw more options, but they were not alone in noticing.
North Whidbey had the same active listing count as last year, 116, but May new listings, pendings, and closed sales were all lower than May 2025. It is still the highest-volume part of the island, but buyers appear more choosy. The market has not stopped. It has started reading the fine print.
Pricing
The average is useful. It is also a little sneaky.
Median active price moved in different directions by area. South Whidbey's median active price was $889,000, down 1.0% from last May. Central Whidbey's was $730,000, down 7.0%. North Whidbey moved higher, up 11.5% to $622,475.
Median Sale Price Trend
Hover points for annual median sale prices, 2013 through 2026 YTD.
South WhidbeyCentral WhidbeyNorth Whidbey
This is where the islandwide average starts acting like it knows more than it does. A waterfront Greenbank property, a Holmes Harbor home with flexible living space, a Mutiny Bay retreat, and a North Whidbey neighborhood home are all technically "Whidbey real estate." They are not the same market in practice.
That matters for pricing. It matters for offers. It matters for how long a listing should sit before a price adjustment becomes a conversation instead of a confession.
Price Bands
The market gets clearer when you stop averaging everything together
South Whidbey had 102 year-to-date sales compared with 97 a year earlier, while new listings rose from 215 to 241. Central Whidbey had 61 year-to-date sales compared with 56 last year, with new listings up sharply. North Whidbey had fewer year-to-date sales and fewer new listings than last year, which tells a different story from Central entirely.
Price Points: Sales vs. New Listings
Choose a view and submarket. Hover bars for exact values.
20262025
The price-band charts show why "the market is up" or "the market is slow" is too blunt to be helpful. South Whidbey had more activity in some upper brackets and fewer sales in others. Central Whidbey added supply across several ranges. North Whidbey softened in lower brackets while still showing life around the middle of the market.
That is not a contradiction. That is Whidbey. Around here, the details do not ride in the back seat; they drive.
What buyers should do with this
Buyers should be encouraged, but not cocky. There are more options in some pockets, and selective sellers may be more willing to talk. But the best-positioned homes can still move quickly, especially when condition, location, and price all show up wearing the same jersey.
Watch the boring things. Days on market. Price changes. Competing inventory. Condition. Inspection risk. Whether the view is truly a view or just a charming peek if you stand on one foot in February.
What sellers should do with this
Sellers should not panic, but they should respect the market. Pricing too high and waiting for the perfect buyer can work when inventory is starved. In a more selective market, that strategy starts to look like leaving the ferry line to "find a shortcut."
A strong seller plan should start with a micro-market review: nearby sales, active competition, price-band movement, condition, view or waterfront premiums, and how buyers are behaving right now for your specific property type.
Averages are only a starting point. Price segments, property types, condition, location, waterfront or view attributes, acreage, neighborhood, and micro-markets can move differently. Before making a pricing, offer, or timing decision, talk with a local Whidbey expert about your specific property or search.
FAQ
Is Whidbey Island a buyer's market or seller's market right now?
It depends on the area and price point. The June Facts & Trends reports described South Whidbey as neutral in May 2026, Central Whidbey as a buyer's market, and North Whidbey as a seller's market. That is why a submarket-specific read matters.
Are Whidbey Island home prices going up or down?
Prices are mixed by area and by property type. South Whidbey and Central Whidbey had lower median active prices than last May, while North Whidbey's median active price was higher. Median sale price trends also vary by submarket.
Why do Whidbey real estate numbers vary so much by area?
Whidbey Island has very different housing segments, including waterfront homes, view properties, wooded acreage, in-town homes, condos, and neighborhood homes. Buyer pools and inventory levels can be very different from South Whidbey to Central Whidbey to North Whidbey.
Should I use islandwide averages to price my Whidbey home?
No. Islandwide averages can provide context, but pricing should be based on your specific property, condition, location, view or waterfront attributes, recent comparable sales, current competition, and the price segment you are in.
Data supplied by the NWMLS and local Windermere Whidbey market report materials. Neither the board nor its MLS guarantees its accuracy, and the data may not reflect all real estate activity in the market. Listing facts were checked against the linked listing pages on June 10, 2026.
Whidbey Island’s spring real estate market is waking up. Over the last 30 to 60 days, more homes have come to market across South, Central, and North Whidbey. At the same time, buyer activity has also picked up, which means the story is more nuanced than simply saying buyers have more choices or sellers have all the leverage.
Based on April 2026 local MLS activity, the Whidbey market is best described as more balanced than overheated, but slightly seller-leaning in the right segments. Move-in ready homes, strong locations, and properties that match active buyer demand can still move quickly. Other homes, especially those that need work, are priced ahead of the market, or sit in slower price bands, may face a more selective buyer pool.
That distinction matters. A broad island-wide market report can show the general direction, but your specific result depends on the micro-market around your property: price range, condition, neighborhood, view, acreage, ferry access, lifestyle features, and current competing inventory.
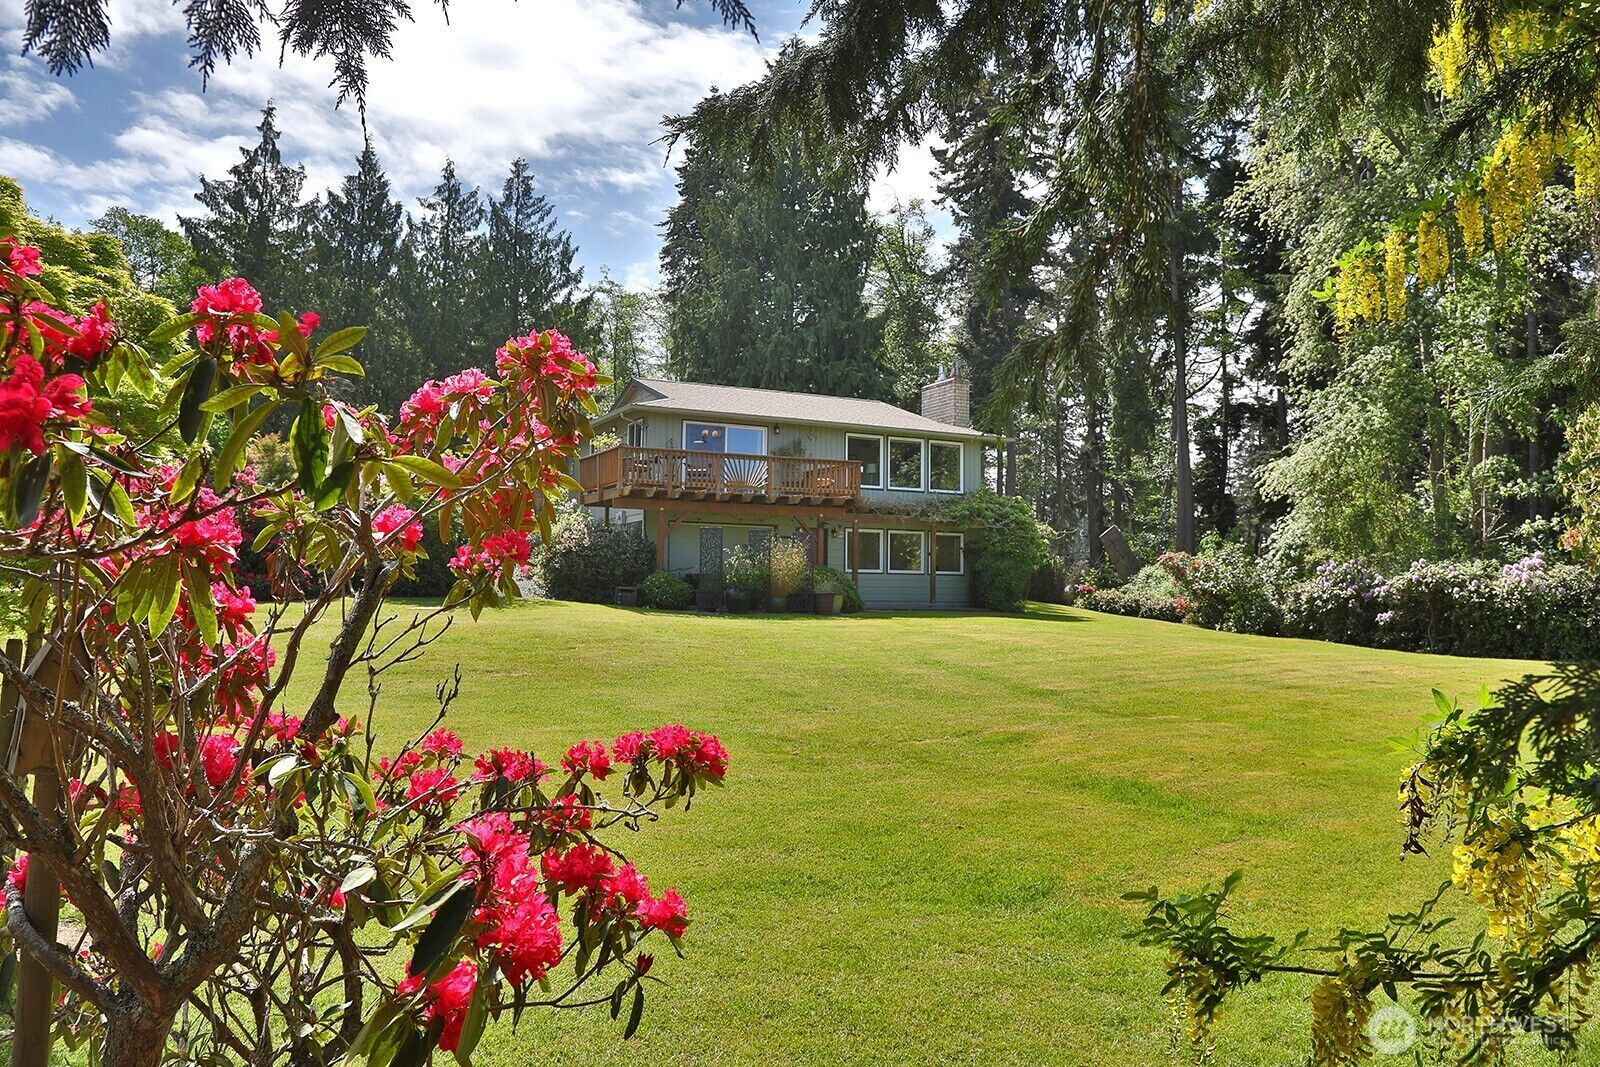
Images and graphics in this article are editorial market visuals created for this update. Current listing examples are used for market context only; listing details and availability can change quickly and should be confirmed with a Windermere Whidbey broker.
Quick Local Takeaways
Inventory rose across all three Whidbey submarkets in April.
Buyer activity also strengthened, especially South Whidbey closed sales and North Whidbey pending sales.
Closed-sales months of inventory was under three months in South, Central, and North Whidbey, which creates a seller-leaning signal.
Pended-sales inventory tells a more balanced story in South and Central Whidbey.
Average sold prices rose, while median sold prices dipped slightly, which suggests the mix of homes sold had a major influence on the numbers.
Different price segments are moving at different speeds.
What Changed As The Spring Selling Season Arrived?
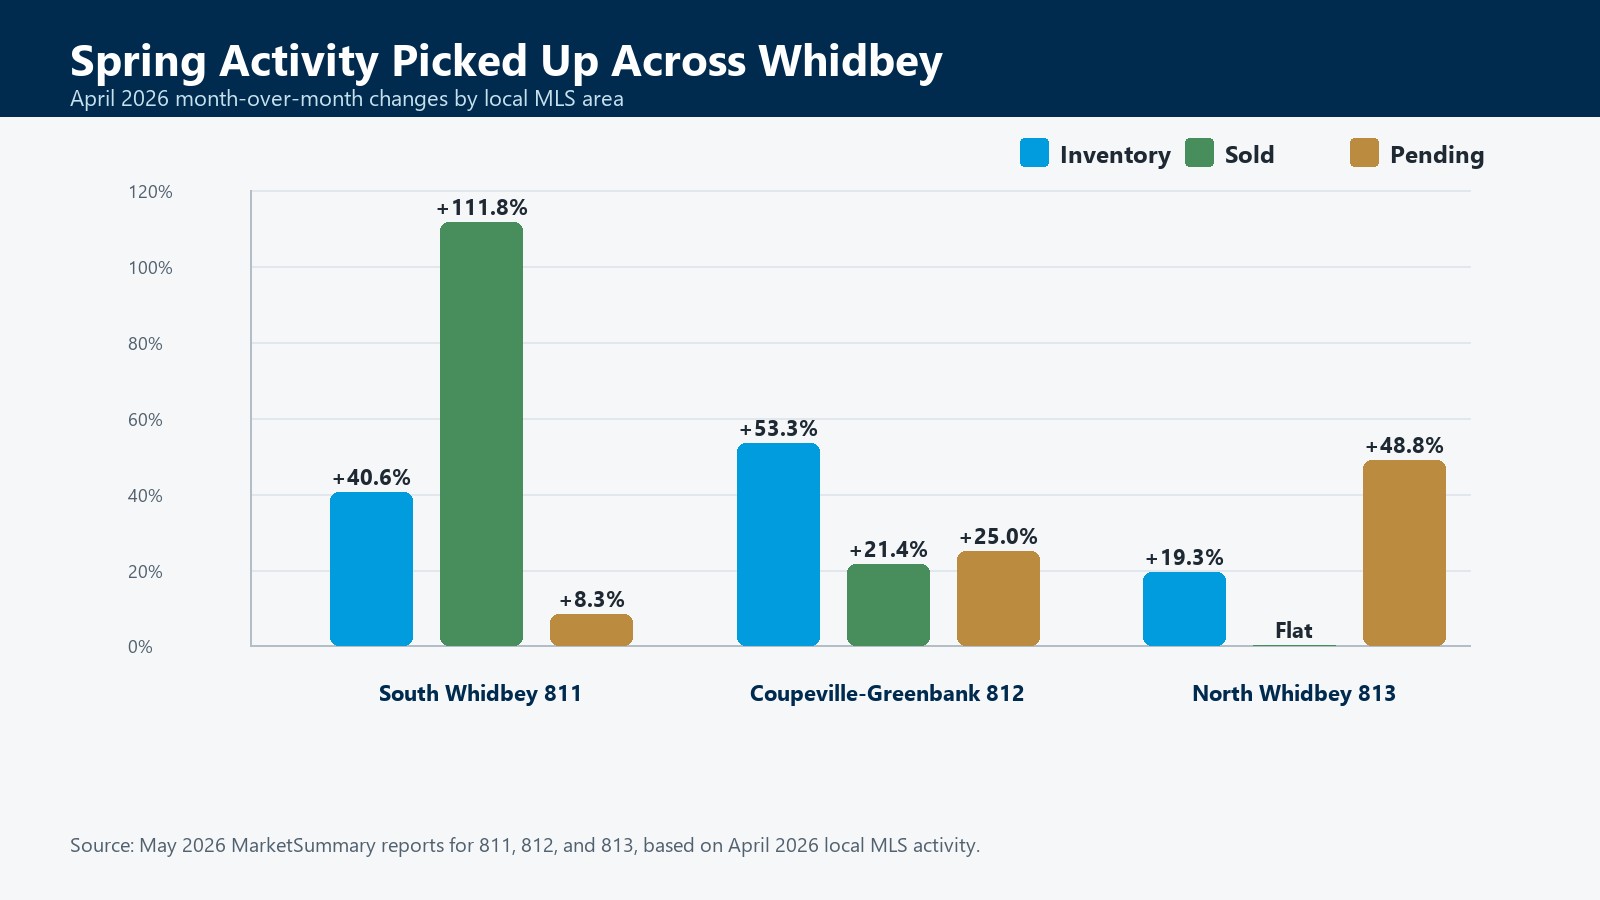
The most visible change is inventory. In April, the number of homes for sale rose 40.6% on South Whidbey, 53.3% in Coupeville-Greenbank, and 19.3% on North Whidbey. That is the spring market doing what spring often does: giving buyers more to look at and giving sellers a more active audience.
But the demand side moved too. South Whidbey closed sales rose from 17 in March to 36 in April. Coupeville-Greenbank sales rose from 14 to 17. North Whidbey closed sales held steady at 40, while pending sales jumped from 41 to 61.
That is why this market does not read like a simple buyer’s market, even with more choices available. More listings are entering the market, but enough buyers are still stepping forward to keep well-positioned properties competitive.
April 2026 month-over-month activity based on May 2026 MarketSummary reports for Whidbey MLS areas 811, 812, and 813.
Whidbey Area
Inventory Change
Sold Change
Pending Change
Closed-Sales Inventory
South Whidbey 811
Up 40.6%
Up 111.8%
Up 8.3%
2.7 months
Coupeville-Greenbank 812
Up 53.3%
Up 21.4%
Up 25.0%
2.7 months
North Whidbey 813
Up 19.3%
Flat
Up 48.8%
2.5 months
Why More Inventory Does Not Automatically Mean A Buyer’s Market
More inventory gives buyers more choices, but it does not automatically shift negotiating power to buyers. The key question is whether new listings are being absorbed by buyer demand.
In April, closed-sales months of inventory was below three months in all three local areas: 2.7 months on South Whidbey, 2.7 months in Coupeville-Greenbank, and 2.5 months on North Whidbey. By that measure, the market still leans toward sellers.
However, pending-sales inventory softens the picture in parts of the island. South Whidbey’s months of inventory based on pended sales was 3.7 months, and Coupeville-Greenbank was 3.1 months, both closer to neutral. North Whidbey was tighter at 1.6 months based on pended sales.
So the more useful read is this: Whidbey is not in a frenzied seller’s market, but it is also not a market where buyers can assume every seller is under pressure. The balance depends heavily on the property.
Price Segments Are Not Moving The Same Way
The pricing data is another reminder to be careful with broad conclusions. Average sold price rose in all three areas in April: up 6.4% on South Whidbey, 20.0% in Coupeville-Greenbank, and 8.3% on North Whidbey. Average sold price per square foot also rose in all three areas.
At the same time, median sold price declined slightly in all three areas. South Whidbey’s median sold price dipped 4.0%, Coupeville-Greenbank dipped 2.2%, and North Whidbey dipped 0.7%.
That difference between average and median is important. It suggests that the mix of homes selling in April influenced the headline numbers. A few higher-priced sales can lift averages even while the midpoint of the market is steady or slightly lower.
Broad market stats can show direction, but price band, property type, condition, and location shape the strategy for each property.
For sellers, that means pricing should be specific, not generic. For buyers, it means a broad headline may not tell you what is happening in the price band you are actually shopping.
The Practical Takeaway
Most local brokers would still describe the market as more balanced than a classic seller’s market, but slightly seller-leaning for move-in ready homes in specific segments. A well-prepared home in the right price range can still attract strong attention. A property with condition, pricing, access, or location challenges may need a more patient and strategic plan.
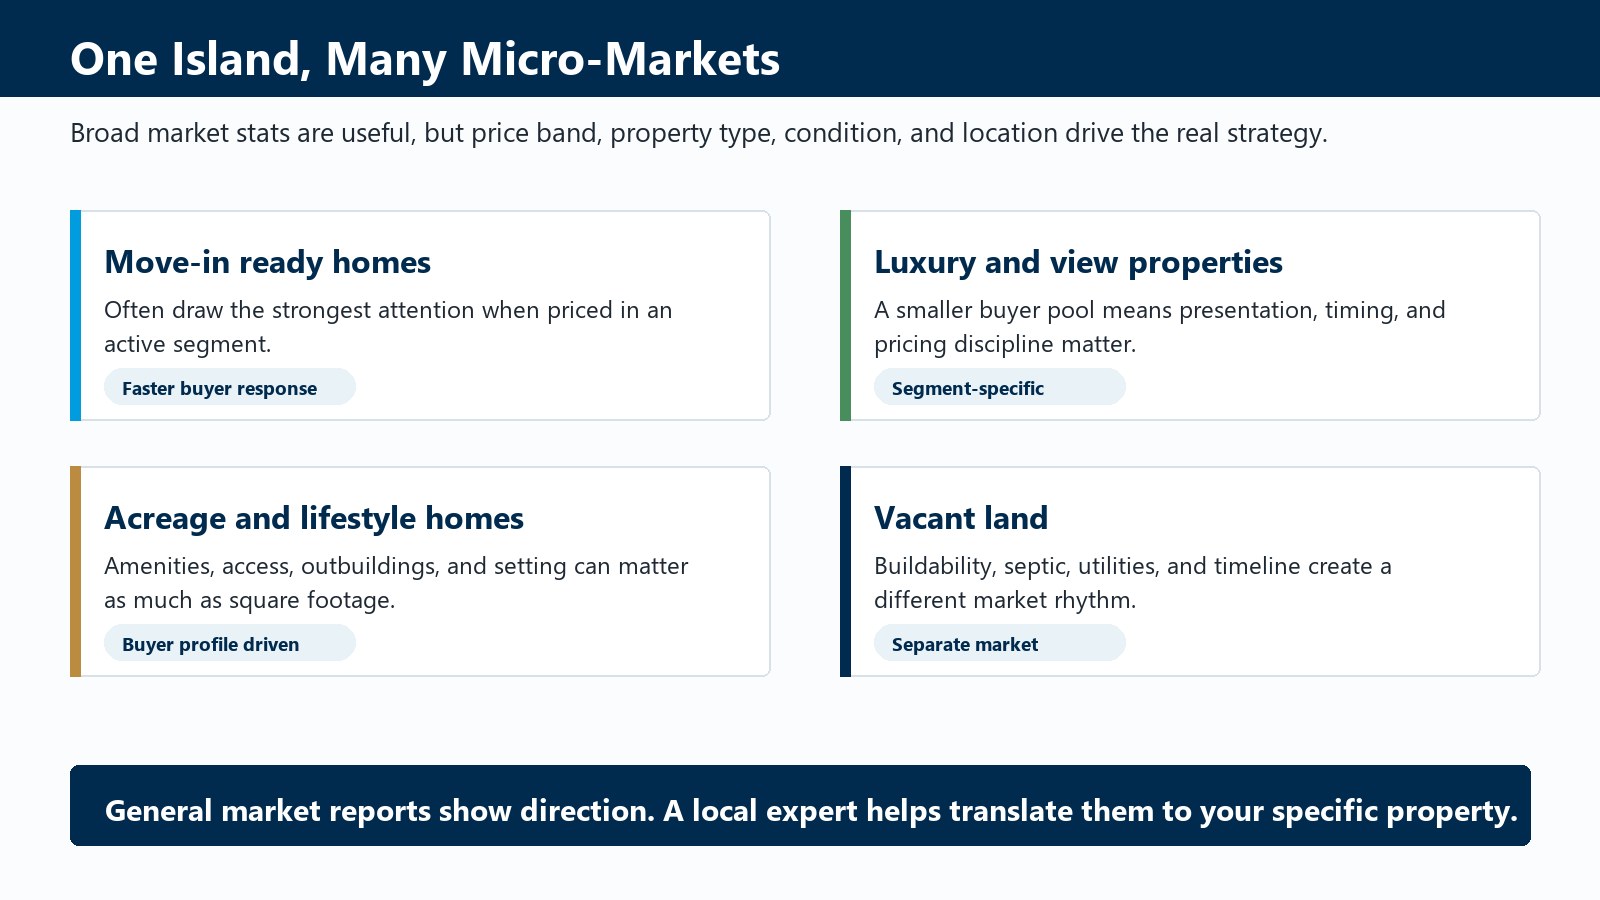
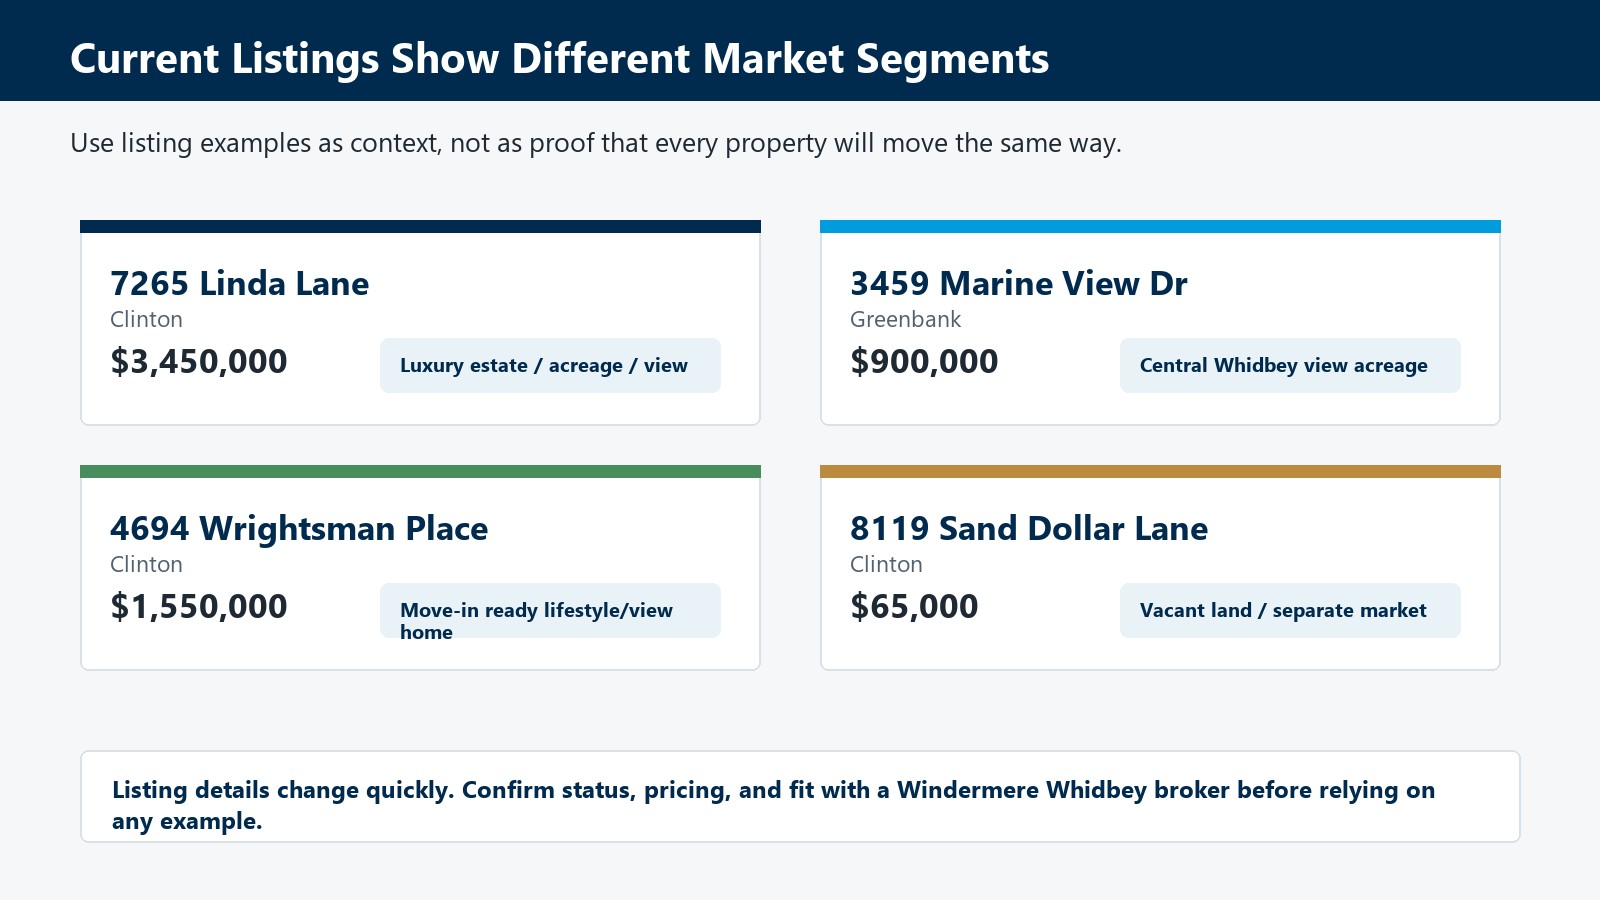
Current Listings Show Why Micro-Markets Matter
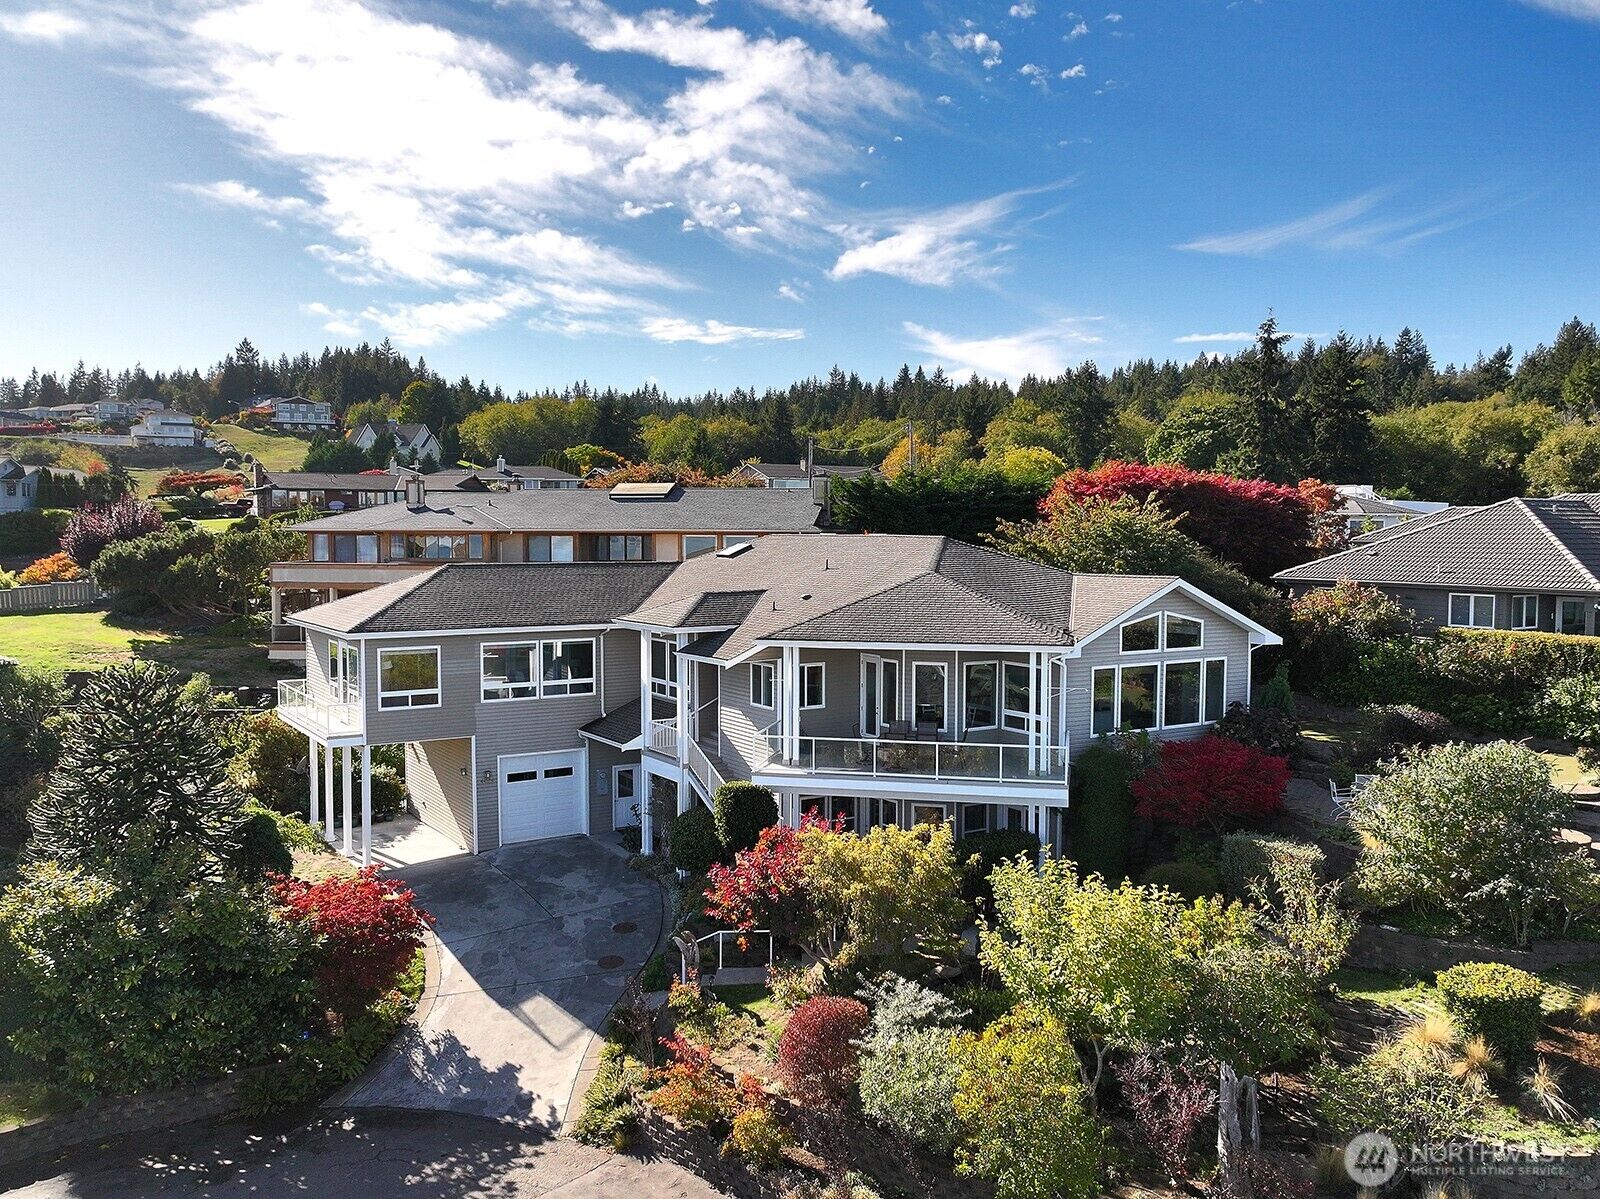
A look at selected Windermere Whidbey active listings shows how many different markets can exist on the island at the same time. These examples are not meant to suggest one universal trend; they show why property type and buyer profile matter.
Current listing examples show why Whidbey Island market conditions should be interpreted by segment, property type, and buyer pool.
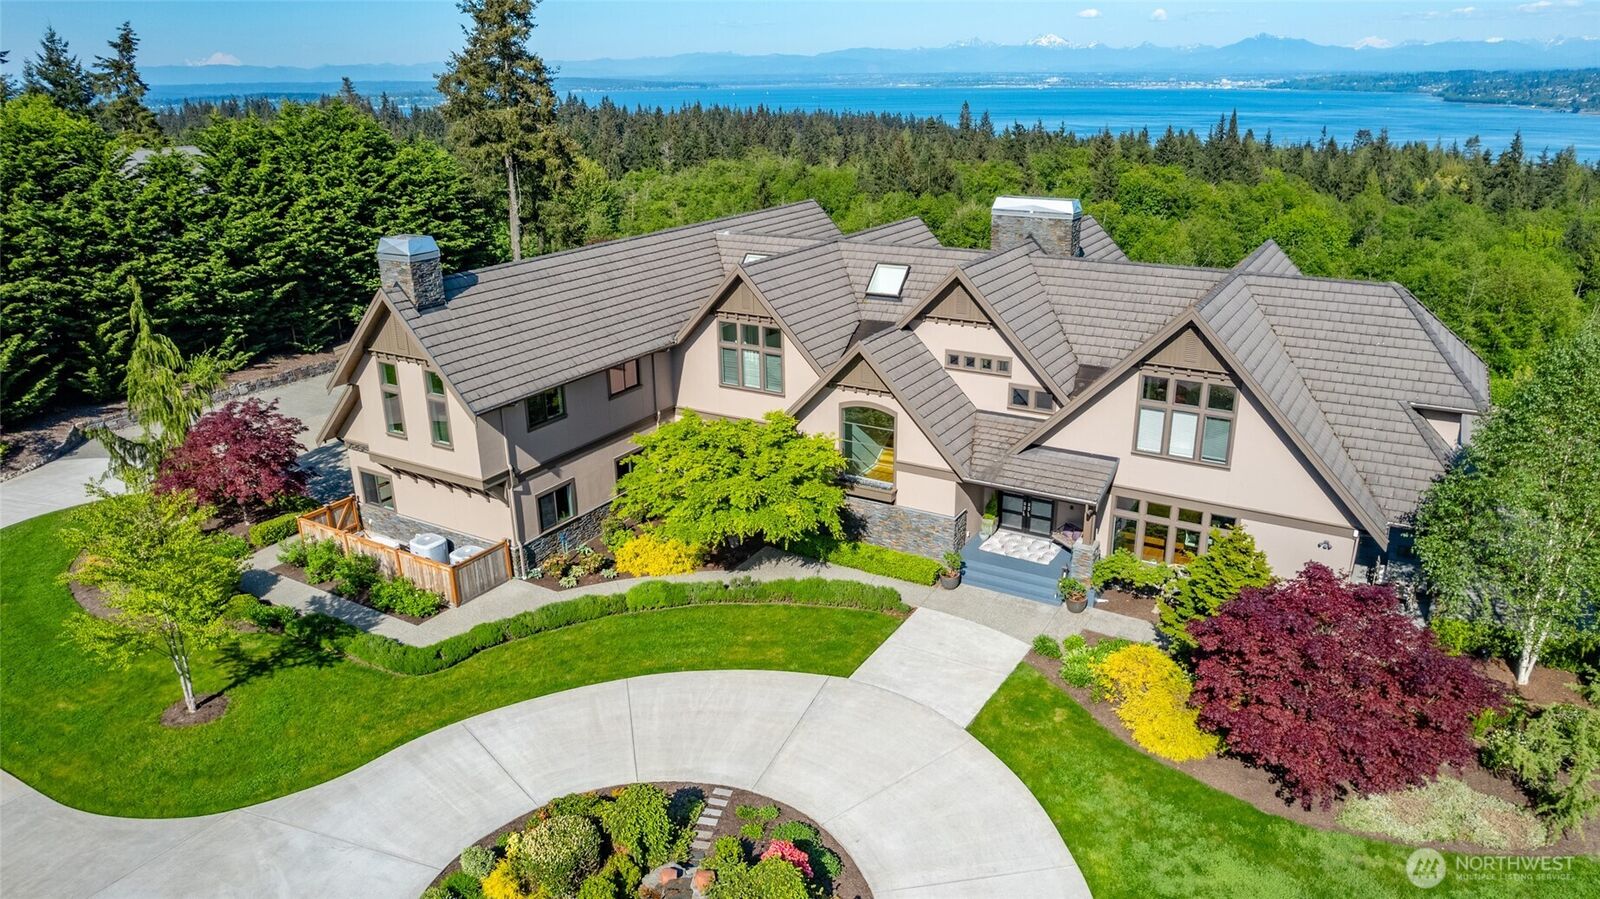
This South Whidbey estate sits in a luxury segment where acreage, privacy, views, ferry access, and high-end amenities all matter. Luxury listings should be interpreted differently than the broader resale market.
This Lagoon Point property blends view acreage, outbuildings, garden space, and community beach/boat launch amenities. Distinctive Central Whidbey properties often speak to a very specific buyer pool.
With Sound and Cascade views, flexible living space, and proximity to the ferry and Langley, this is the kind of lifestyle-specific South Whidbey home that may appeal strongly to the right buyer.
Land is its own market. Septic, utilities, neighborhood amenities, buildability, and buyer timeline all shape demand differently than a move-in ready home.
Listing details and availability can change quickly. These examples were drawn from the Windermere Whidbey active listings page and should be confirmed before making decisions.
What This Means If You Are Thinking About Selling
If you are considering selling this spring or early summer, the good news is that buyer activity is present. The better news is that buyers are responding to homes that feel well-prepared, well-priced, and easy to understand.
That does not mean every property should be priced aggressively. In a more balanced market, buyers compare options carefully. Presentation, condition, photography, pricing strategy, and launch timing all matter.
The strongest seller position is usually created before the home goes live: understanding nearby competition, identifying the likely buyer pool, preparing the property for that buyer, and pricing with enough discipline to generate early interest.
What This Means If You Are Thinking About Buying
For buyers, the spring market is offering more options than the winter market did. That is helpful, especially if you have been waiting for more variety in location, lifestyle, acreage, view, or price point.
Still, more options do not mean every good listing will sit. If a home is move-in ready, well-located, and priced in a competitive segment, it may still require a clear plan and a timely offer.
The best buyer strategy is to know your segment before you write. A buyer looking at North Whidbey homes near the median price is not in the same market as a buyer comparing South Whidbey luxury estates, Central Whidbey acreage, or vacant land.
A local market conversation can help translate broad Whidbey Island trends into the specific context around one property or search.
The Bottom Line
Whidbey Island’s spring 2026 market is active, but it is not uniform. Inventory is up, demand is present, and the market is slightly seller-leaning in the right pockets. At the same time, buyers have more choices than they did earlier in the year, and sellers still need to be thoughtful about pricing and preparation.
If you are trying to understand what this means for your home, your search, or your next move, the most important question is not just “What is the Whidbey market doing?” It is “What is happening in my specific micro-market right now?”
Talk With A Local Expert
Windermere Whidbey brokers work in these micro-markets every day. If you are thinking about selling, buying, or simply trying to understand the value and timing around a specific property, a local conversation can help you separate the broad trend from the details that matter most.
FAQ
Is Whidbey Island in a seller’s market right now?
Based on April 2026 closed-sales months of inventory, South Whidbey, Coupeville-Greenbank, and North Whidbey all showed seller-leaning conditions. But the market feels more balanced than overheated, and results vary by price range, condition, location, and property type.
Are more homes coming on the market this spring?
Yes. April inventory rose month over month across all three Whidbey submarkets reviewed: South Whidbey, Coupeville-Greenbank, and North Whidbey.
Does more inventory mean buyers have more negotiating power?
Sometimes, but not always. Buyers have more choices than they did earlier in the year, but buyer activity has also increased. Well-prepared homes in desirable segments may still attract strong attention.
Why do local price segments matter so much?
Whidbey Island includes many different property types, from move-in ready homes and view properties to acreage, luxury estates, condos, and land. Each segment can move at a different pace, so broad market averages should not be applied too casually to one specific property.
Headlines Have You Worried About Your Home’s Value? Read This.
If you’ve been scrolling through national news feeds lately, you might be feeling a little uneasy about the housing market. Sensational headlines about “crashing prices” or “frozen markets” are designed to get clicks, but they often miss the mark when it comes to what is actually happening in our local neighborhoods.
Real estate is hyper-local. What happens in Phoenix or Austin doesn’t necessarily reflect what is happening in Langley, Coupeville, or Oak Harbor.
If you are a Whidbey Island homeowner wondering what your home is really worth in today’s market, here is the local reality based on our latest market trends.
1. Whidbey Island is Seeing More Activity, Not Less
While some headlines suggest buyers are disappearing, our local data tells a different story. According to our office’s latest trend graphics for November 2025, Pending Sales are up a massive 28% compared to this time last year.
This is a critical indicator. It means that despite interest rate fluctuations, buyers are actively writing offers and getting under contract. We also saw a 7.6% increase in closed sales year-over-year. The demand for island life remains robust.
2. More Inventory = More Balance
You might see that the number of homes for sale is up by roughly 27% compared to last year. While a spike in inventory can sound alarming, in our case, it represents a return to a more balanced, “neutral” market.
For years, we suffered from a chronic lack of inventory that made it frustrating for buyers. Now, buyers have more choices, which is why we are seeing that jump in pending sales. The market isn’t stalling; it’s functioning.
3. The Balance of Power is Shifting (Again)
The story of 2025 hasn’t been one-sided. For much of the year—especially in South Whidbey—buyers enjoyed significant leverage. We saw frequent price reductions and successful negotiations in the buyer’s favor, particularly for homes that needed work or were priced aggressively.
However, the market is shifting again. In the fourth quarter, as the number of new listings has seasonally dipped, leverage has begun to swing back slightly toward sellers. High-quality inventory is scarce.
The Takeaway? It is a bifurcated market. Move-in ready homes and properties with views are still selling quickly and for top dollar. Meanwhile, properties that require updates may still see longer market times. Correct pricing is more critical now than ever.
The Bottom Line
Don’t let national fear-mongering derail your plans. The data shows that the Whidbey Island market is active, balanced, and resilient.
If you are thinking of selling, you don’t need to panic—you just need a strategy. Connect with us to help you navigate this shifting market with confidence.