Facebook
 X
X
 Pinterest
 Copy Link

Should I Wait for Lower Interest Rates to Buy on Whidbey Island?
If you are planning to purchase a home in 2026, you are likely watching the shifting financial news and asking yourself: should I wait for lower interest rates Whidbey Island? It is the single most common question prospective buyers are asking this year. The desire to secure the lowest possible monthly payment is entirely understandable, but attempting to perfectly time the real estate market often leads to unintended financial consequences. Let’s explore what waiting really costs you in Island County.
Key Takeaways
- Waiting for a slight drop in interest rates often results in paying a higher overall purchase price due to increased buyer competition.
- Whidbey Island is seeing highly localized demand, with South Whidbey experiencing a significant surge in sales volume early in 2026.
- Securing a home now allows you to start building equity immediately, rather than paying a premium later.
- You can always refinance your mortgage when rates drop, but you cannot renegotiate your purchase price after the fact.
The Hidden Cost of Waiting for Mortgage Rates to Drop
Direct Answer: Waiting for lower mortgage rates in 2026 can cost Whidbey Island homebuyers significantly. As rates dip, buyer competition increases, driving up home prices and reducing your negotiating power. Purchasing now allows you to start building equity in Island County real estate before the busy spring market accelerates further.

There is a well-documented, inverse relationship between interest rates and home prices. When mortgage rates drop, purchasing power theoretically increases, bringing a flood of sidelined buyers back into the market. On a highly desirable, inventory-constrained location like Whidbey Island, this sudden influx of competition inevitably drives home prices upward.
If you wait for rates to drop by half a percentage point, you might save a few hundred dollars on your monthly payment. However, if the cost of the home increases by $30,000 to $50,000 during that same waiting period due to bidding wars, your perceived “savings” vanish entirely. Furthermore, waiting costs you leverage. In a hyper-competitive market fueled by low rates, advantages like seller concessions disappear. If you are ready to evaluate buying a home, acting before the masses return is often the strongest financial play.
North vs. South Whidbey: How Buyer Demand is Shifting in 2026
Direct Answer: Buyer demand varies significantly across Whidbey Island in early 2026. North Whidbey remains the highest volume market with 114 homes sold year-to-date, maintaining last year’s strong pace. Meanwhile, South and Central Whidbey areas are experiencing a massive 29% surge in growth, with 36 homes already sold to eager buyers.
Data Fact: Whidbey Island YTD Sold Homes — North Whidbey: 114 homes (+0%), South Whidbey: 36 homes (+29%) (Source: Windermere Whidbey Weekly NWMLS Report, March 16, 2026)
It is a mistake to treat Whidbey Island as a single, homogenous real estate market. The proprietary data from our weekly NWMLS reports reveals a fascinating split in buyer behavior this year. Up north, in areas like Oak Harbor and Coupeville, the market is demonstrating incredible stability. With 114 closed sales already this year, it represents the bulk of the island’s inventory and transactions, holding perfectly steady with 2025’s volume.
However, the real urgency is materializing in the southern half of the island. If you are looking at neighborhoods in Langley or searching for homes in Freeland, the data shows that the spring rush has already begun. A 29% year-over-year increase in sold homes indicates that buyers in South Whidbey are no longer waiting on the sidelines. They have recognized that the cost of waiting is too high, and they are actively securing properties before inventory tightens further.
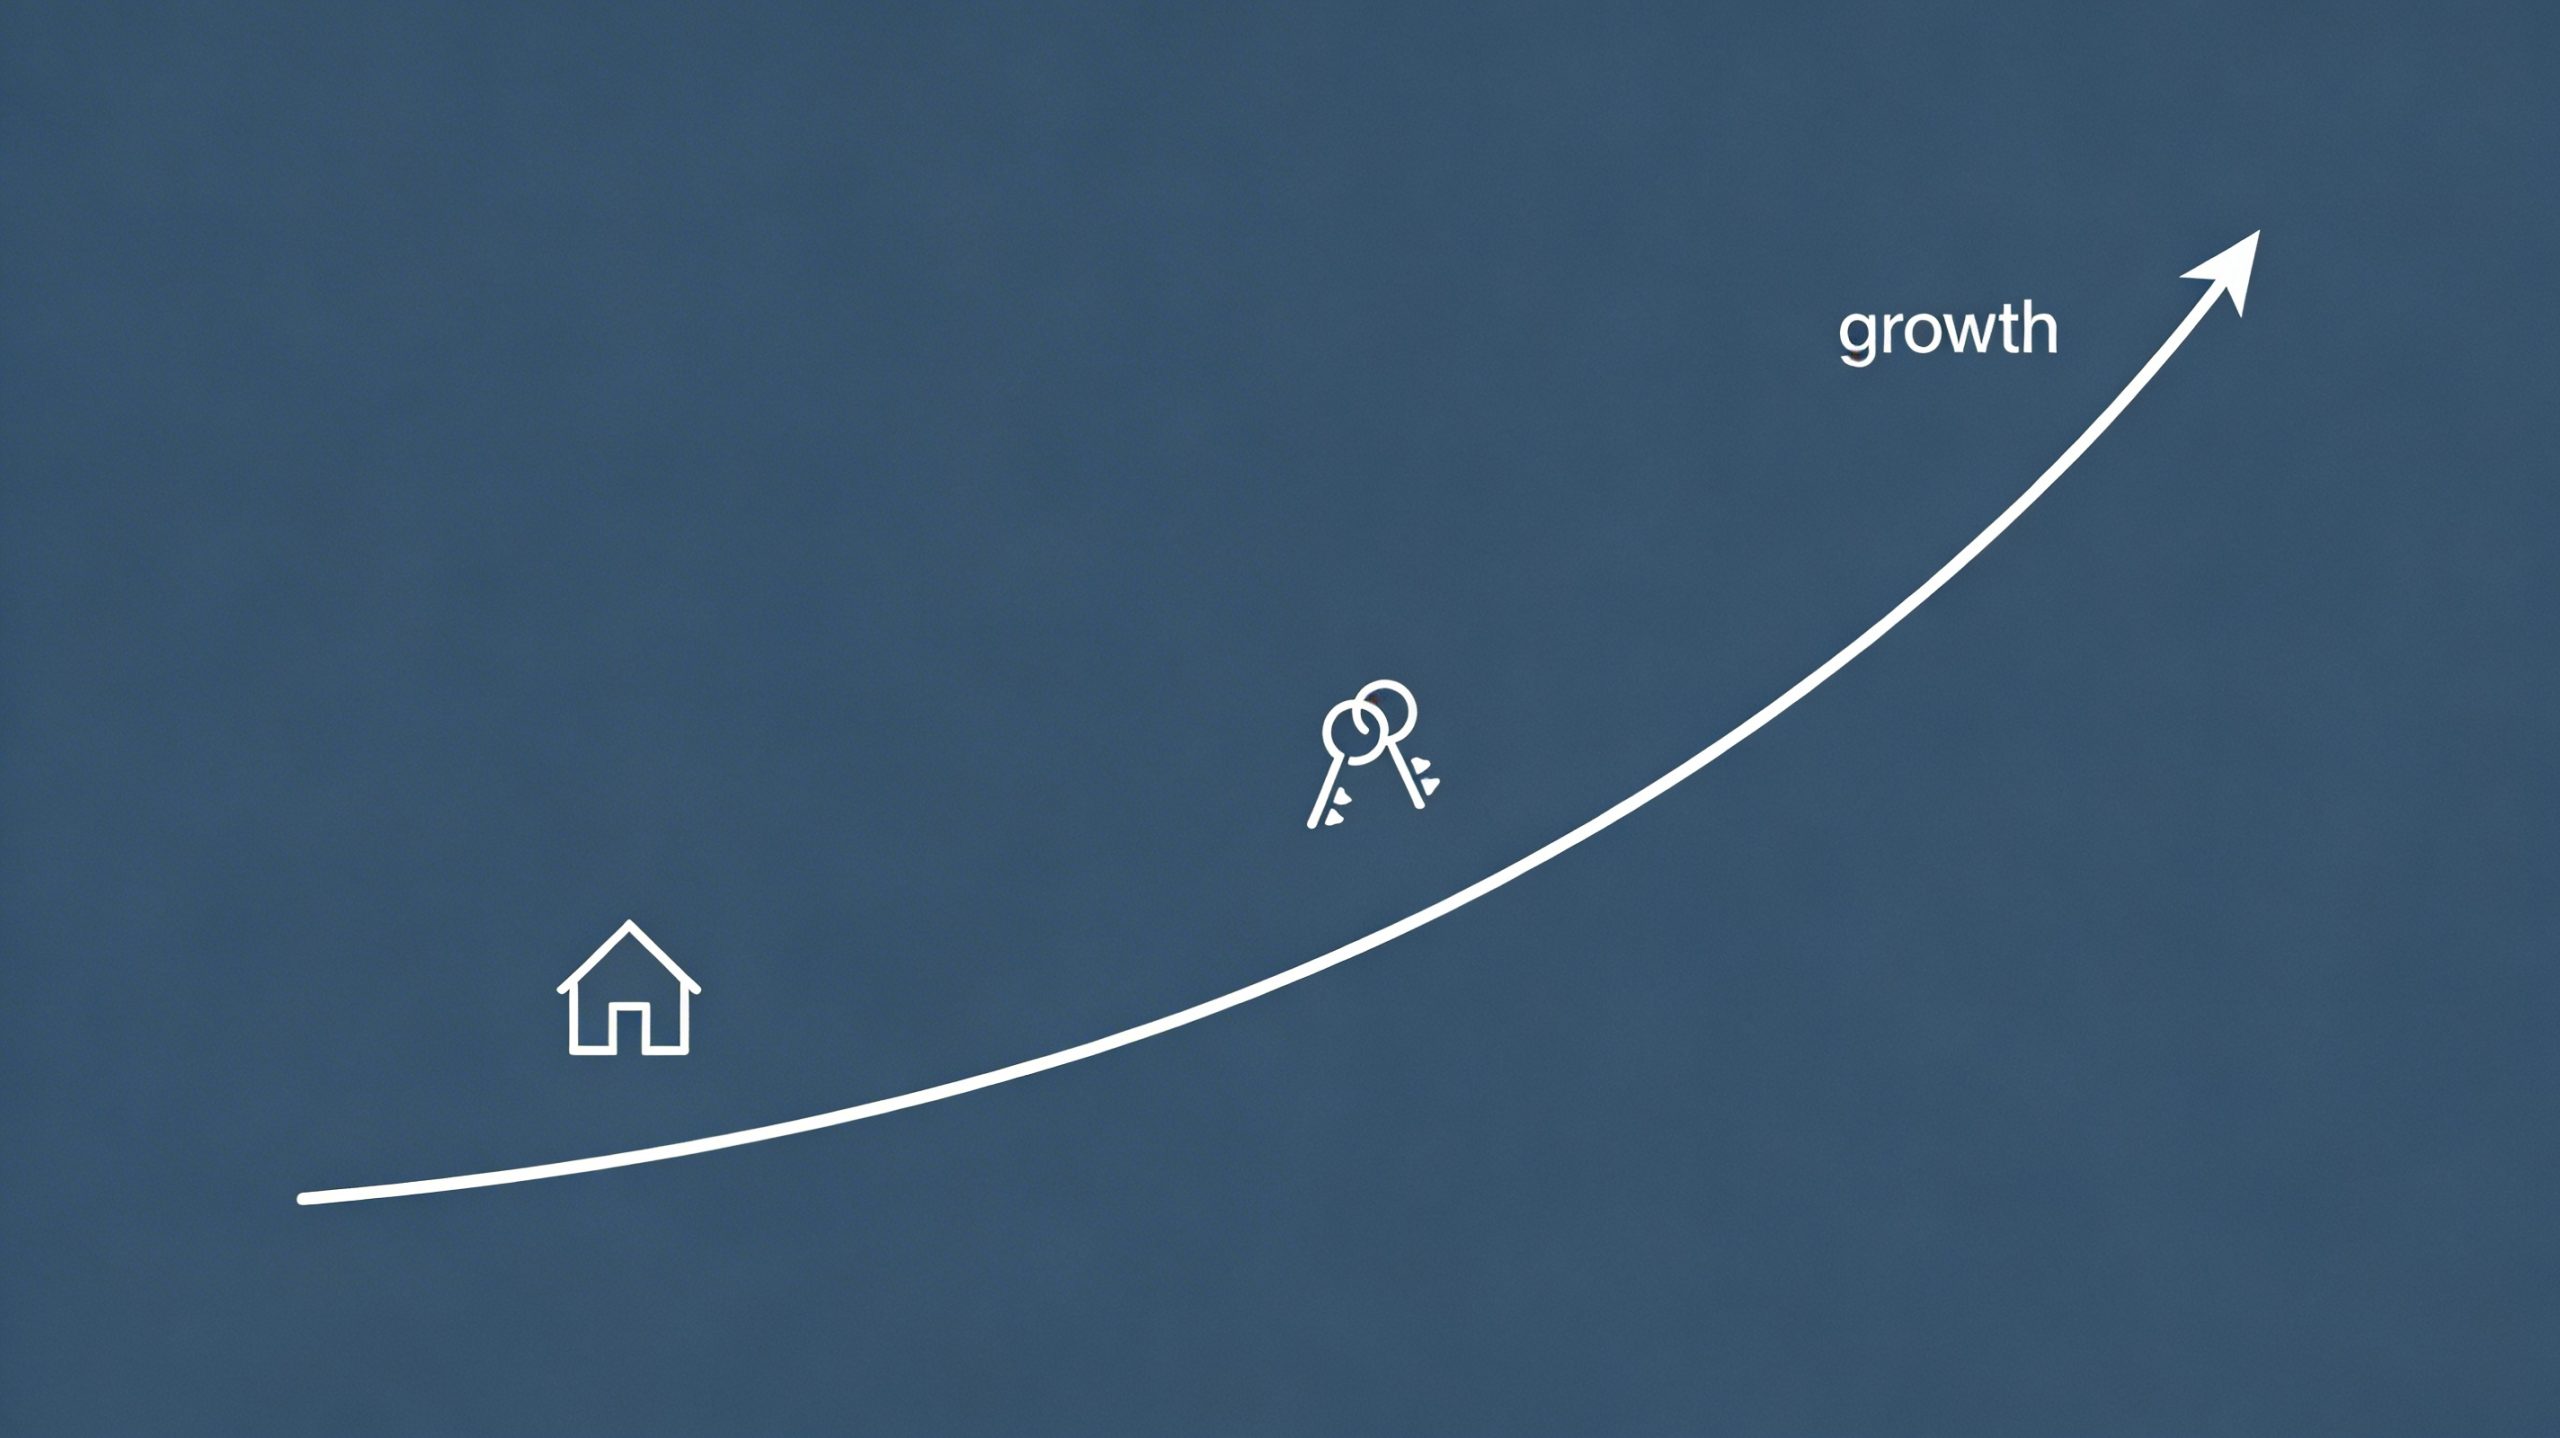
The Math: Home Equity Growth vs. Interest Rate Savings
Direct Answer: The financial cost of waiting to buy a house on Whidbey Island often outweighs the savings of a slightly lower interest rate. Historically, as rates fall, home prices rise. Buying a home now secures your purchase price, allowing you to gain equity rather than paying a premium later.

Real estate wealth is primarily generated through time in the market, not timing the market. Let’s look at the practical math of home equity. When you purchase a home, your monthly mortgage payment acts as a forced savings account, slowly paying down your principal while the property ideally appreciates in value over the years.
When you choose to continue renting while waiting for interest rates to shift, you are paying 100% interest to your landlord. You are building their equity, not your own. Furthermore, keeping a close eye on Whidbey Island market trends shows that property values in the Pacific Northwest historically trend upward. The equity you could have been building over a six-to-twelve-month waiting period is permanently lost, replaced instead by the reality of having to borrow a larger sum of money to cover the newly inflated purchase price of the exact same home.

The “Date the Rate, Marry the House” Strategy for Whidbey Buyers
Direct Answer: The popular date the rate, marry the house strategy encourages buyers to purchase their ideal Whidbey Island home now, despite current interest rates. You can refinance the mortgage later when rates inevitably drop, ensuring you do not miss out on your dream property or face stiffer buyer competition.

This phrase has become a mantra in modern real estate for good reason. It perfectly encapsulates the mindset shift required to succeed in a fluctuating economic environment. Your interest rate is a temporary financial instrument; it can be altered, refinanced, or bought down. The home itself—the physical location, the views of the Puget Sound, the neighborhood—is permanent.
If you find a property that perfectly fits your lifestyle while you explore Whidbey Island communities, walking away because the current interest rate is half a point higher than you would prefer is a massive risk. By the time the rates drop to your target number, that specific home will be gone, and the comparable homes that hit the market will likely be priced higher. Marry the house to lock in your purchase price and secure your slice of the island, and simply “date” the mortgage rate until a better financial opportunity arises to refinance.
How to Prepare for the 2026 Whidbey Island Housing Market
Direct Answer: To succeed in the competitive 2026 Whidbey Island housing market, prospective buyers must get pre-approved for a mortgage early and partner with a local Windermere expert. Understanding hyper-local trends in communities like Greenbank gives you the necessary leverage to make a strong, winning offer right now.

Preparation is the ultimate antidote to market anxiety. If you have decided that the cost of waiting is too high, your next step is to get strategically positioned. First, speak with a reputable local lender to get fully pre-approved. Local lenders understand the nuances of Island County properties (such as well and septic requirements) much better than out-of-state mega-banks.
Second, partner with a broker who has deep, data-driven knowledge of the island’s micro-markets. Knowing the difference in buyer demand between Oak Harbor and specific areas like Greenbank or Bayview Corner dictates how aggressively you need to structure your offer. We can also help ensure your current property is Windermere Ready if you need to sell your current home before you buy.
Ready to Navigate the 2026 Whidbey Market?
The 2026 spring market in South Whidbey towns like Langley and Freeland is already accelerating. Don’t let your dream home get caught in a bidding war while you wait for interest rates to shift. Contact a Windermere Whidbey broker today for a consultative, no-pressure discussion about your buying power, local inventory, and the best strategy for your family.
Frequently Asked Questions
Will Whidbey Island home prices drop if I wait until late 2026?
It is highly unlikely. While real estate is local, Whidbey Island suffers from a persistent lack of inventory and high demand from retirees, military personnel, and remote workers. Even as interest rates fluctuate, the fundamental lack of housing supply historically keeps home prices stable or rising.
How much equity do I lose by waiting for a 1% interest rate drop?
This depends on the purchase price of the home and the time it takes for rates to drop. However, if a $600,000 home appreciates at a modest 4% annually, waiting just one year costs you $24,000 in lost equity—often far more than the first year’s savings of a 1% lower interest rate.
Should I sell my current home before buying on Whidbey Island?
In a competitive market, having your current home already sold or under contract makes your purchase offer significantly stronger. If you need to sell your current house to finance your Whidbey purchase, we highly recommend consulting with a broker to perfectly time both transactions.
Does the “date the rate, marry the house” strategy work for Island County real estate?
Yes. Because Whidbey Island is a highly desirable destination market, securing the physical property is often the hardest part of the equation. Locking in your purchase price now protects you from future bidding wars, allowing you to refinance later when macroeconomic conditions improve.
Is it better to buy a fixer-upper in Freeland or wait for a turnkey home?
Turnkey homes in Freeland and Langley move incredibly fast and command premium pricing. If you are willing to put in some work, buying a home that needs cosmetic updates is a fantastic way to bypass heavy competition and force immediate equity into the property.
Are seller concessions still available in Oak Harbor in 2026?
Because North Whidbey is currently seeing stable, balanced transaction volume compared to the surge in the south, buyers may have slightly more negotiating power in Oak Harbor. Your broker can help you determine if asking for rate buy-downs or closing costs is viable for a specific property.
What are the risks of waiting for the spring housing market to peak?
The primary risk is peak competition. During the height of the spring and summer markets, you are competing against the maximum number of buyers. This often leads to waived contingencies, escalation clauses, and paying well over the asking price.
Next Steps
- Discuss your 2026 buying strategy → buying a house on Whidbey
- Explore Whidbey Island by area
- Contact Windermere Whidbey
Written by Si Fisher.