Facebook
 X
 Pinterest
 Copy Link

SOUTH WHIDBEY · SEPTEMBER 2026 MARKET UPDATE
Sales continue. The pace is easing.
Area 811 · September results, with an early-October check-in · Prepared October 20, 2026
Homes are still selling on South Whidbey, but sellers are having to work harder for the sale. September brought fewer new contracts than August, longer average market time, and closings further below asking prices. Taken together, those signals point to easing seller leverage—not a market that has stopped moving.
The recent sales also tell a more interesting story than “higher-priced homes are sitting.” In the last 30 days, as of October 20, 2026, 14 of 35 closings were between $1 million and $2 million. Another 18 were below $800,000. Where your home fits—and what buyers can choose instead—matters more than a single market-wide label.
The market in 30 seconds
September 2026, compared with August
30
Homes went under contract
Down from 41 homes in August: 11 fewer homes went under contract.
47 days
Average days on market
Up from 35 days in August: an increase of 12 days.
139
Homes for sale at month-end
Up from 135 homes at the end of August: four more homes for buyers to consider.
97%
Of the final asking price
Sale prices were about 3% below final asking prices, compared with about 1% below in August.
September 2026 versus August 2026 · TrendGraphix, Area 811 single-family homes and condos. Ratios describe reported closed-sale pricing, not seller-paid credits.
What is changing right now?
The pace of completed sales has eased since July. Closings moved from 38 in July to 33 in August and 31 in September. At the same time, supply relative to that sales pace increased from 3.8 to 4.5 months. That leaves September in a broadly balanced market, with supply taking longer to sell through than in July.
| Measure | July | Aug. | Sept. |
|---|---|---|---|
| Closed sales | 38 | 33 | 31 |
| New contracts | 26 | 41 | 30 |
| Available homes | 146 | 135 | 139 |
| Months of supply | 3.8 | 4.1 | 4.5 |
Source: TrendGraphix Facts & Trends data table. Months of supply uses closed sales; it is a market balance measure, not a forecast of how long an individual home will take to sell.
New contracts give a more recent read on buyer decisions than closings do. September’s 30 contracts were down from August’s 41, but above July’s 26. That is a pullback from a stronger August, not an uninterrupted decline. Inventory also remained below July’s level, so this is not a simple story of more homes piling up every month.
The stronger case for a softer market comes from several signals agreeing: slower closings, longer market time, and lower sale-to-list-price ratios. One monthly count alone would be a much thinner basis for a pricing decision.
Where are homes actually selling?
35 South Whidbey homes sold in the last 30 days, as of October 20, 2026. The chart groups those completed sales by price. Available homes are the listings buyers could choose from on October 20, 2026.
South Whidbey · Closed sales by price
Last 30 days · As of October 20, 2026
Sales are completed closings during the last 30 days. Available homes are listings on the market on October 20.
| Price bracket | Closed sales | Available |
|---|---|---|
| Below $600K | 8 | 23 |
| $600K–<$800K | 10 | 27 |
| $800K–<$1M | 3 | 29 |
| $1M–<$2M | 14 | 35 |
| $2M+ | 0 | 11 |
35 sales total · 125 available listings · Bars use the same 0–15 sales scale. K = thousand; M = million. Sold homes are grouped by sale price; available homes by asking price. Available counts are an October 20 snapshot, not homes newly listed during the 30 days.
Source: NWMLS Area 811 Area Market Survey, generated October 20, 2026. Closed sales: last 30 days, as of October 20, 2026. Active listings: October 20, 2026.
What does this mean for your price range?
Last 30 days · As of October 20, 2026
Sales are completed closings during the last 30 days. Available homes are listings on the market on October 20.
Below $800,000
Just over half of recent sales
18
Sold in the last 30 days
50
Available October 20
Buyers are active in this range. Sellers still need to stand out among homes with similar locations, condition, and features.
$800,000 to under $1 million
Watch the competition closely
3
Sold in the last 30 days
29
Available October 20
With relatively few recent closings alongside available choices, buyers and sellers should take a close look at comparable listings and price history.
$1 million to under $2 million
Buyers are still making moves
14
Sold in the last 30 days
35
Available October 20
This bracket accounted for 40% of recent closings. Higher-priced homes are selling, though results depend on the property and its competition.
$2 million and above
A quieter short-term snapshot
0
Sold in the last 30 days
11
Available October 20
No homes closed in the last 30 days, as of October 20, 2026. With a small, varied group of properties, individual comparisons are more useful than a broad market verdict.
Keep the comparison in perspective: sales cover the last 30 days, as of October 20, 2026; available homes are a snapshot as of October 20, 2026. Sales are grouped by closing price and available homes by asking price. These counts do not measure how quickly a particular home will sell or establish which bracket is most competitive. Small samples can change quickly.

For sellers, the asking price is only part of the plan
September’s reported sale-to-list-price ratio was 97%, down from 99% in August. Relative to the original asking price, it was 95%, down from 97%. These figures are consistent with more pressure on pricing, but they do not measure how many listings reduced their price or when those reductions happened.
Make the first two weeks a review point. Discuss showing activity, buyer feedback, new competing listings, and whether the asking price is producing serious interest. A reduction should respond to that evidence; the calendar alone is not a pricing strategy.
Prepare for a conversation about closing-cost help. A buyer may ask for a seller credit even when the offer price looks acceptable. Discuss possible concessions with your broker before an offer arrives, and compare offers by their expected net proceeds and terms. A higher headline price with a larger credit may leave you with less.
The published sale-to-list-price ratios do not tell us the seller’s net after credits. For a pricing discussion, that distinction matters: the recorded closing price and the amount the seller keeps are different numbers.
For buyers, there may be room to negotiate—property by property
Buyers may have more negotiating room, especially once a home has been on the market for two weeks or longer. Based on what our office is seeing, that is a useful point to look more closely at showing activity, price reductions, and competing listings. If interest has slowed or the seller has already adjusted the price, there may be an opportunity to negotiate a lower purchase price, help with closing costs, or other terms that matter to you.
Two weeks is a cue to investigate, not a guarantee of a discount. A well-priced home may still attract competing offers, and two weeks does not automatically change a seller’s position. Ask your broker to assess the listing’s history and current alternatives, then build an offer around that evidence. The recent $1–2 million closings are a reminder that buyers are still acting on homes that fit.
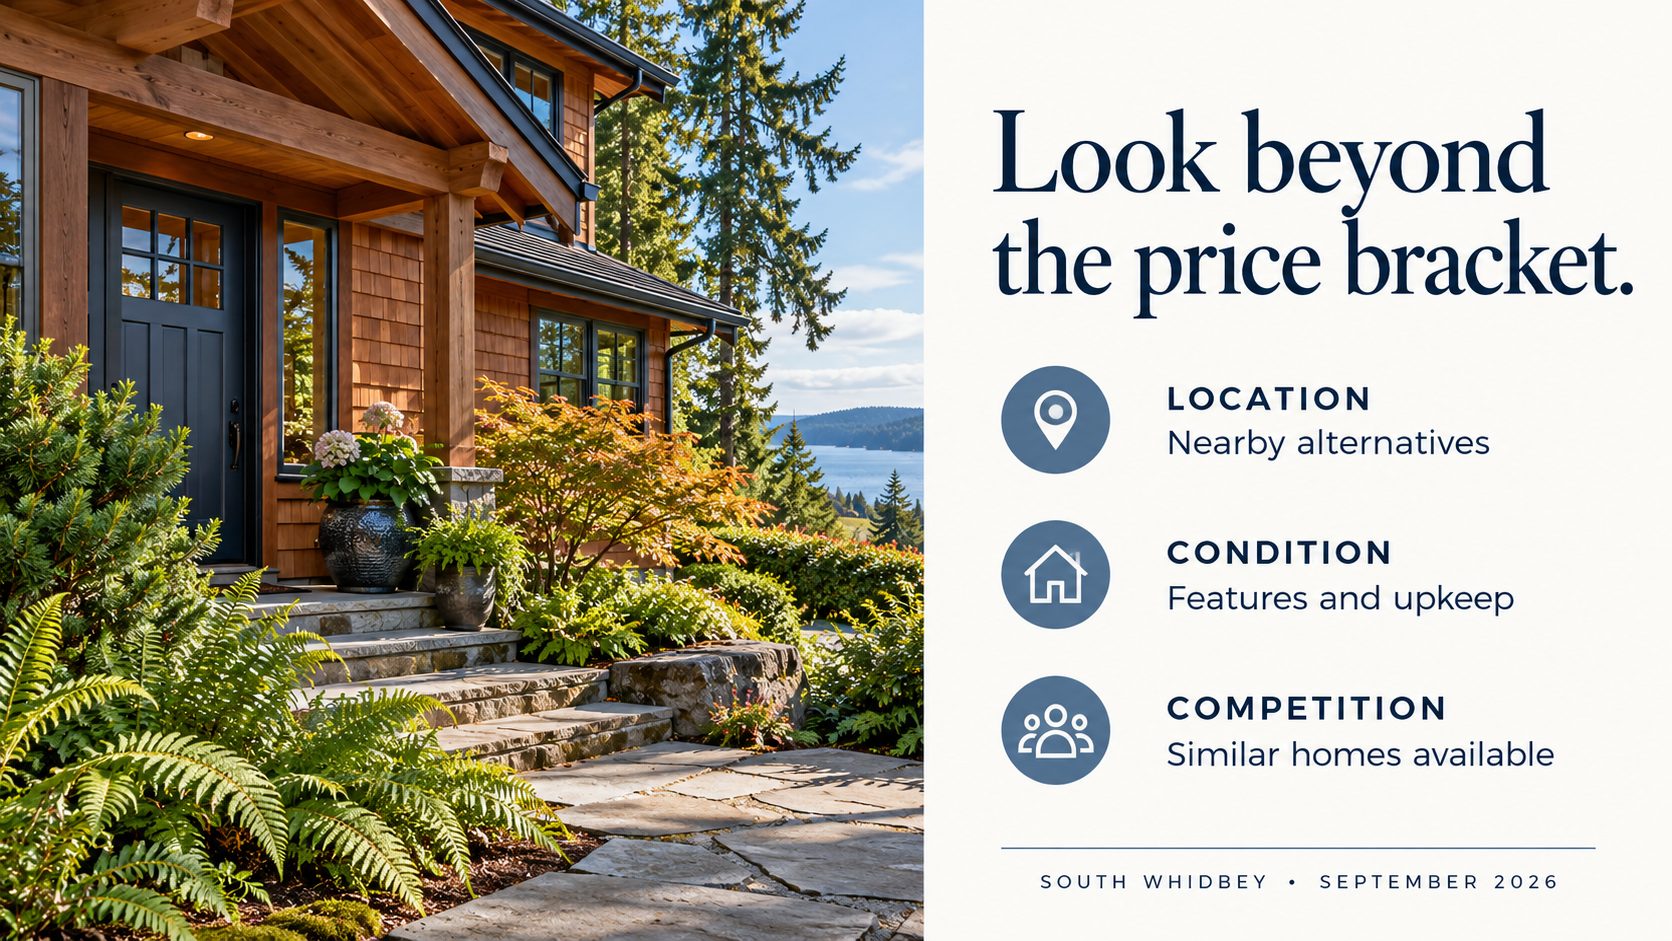
Why a higher median does not cancel out the slowdown
September’s median sale price rose to $710,000 from $675,000 in August. That can coexist with slower activity: the median describes the midpoint of the homes that closed, while contracts, market time, and supply describe different aspects of the market. A different mix of homes can move the median without every property changing value.
For a homeowner, the practical question is what a similar property would compete with today—not whether the entire area’s median moved up or down.
Early October: what to watch next
The October 1–19 figures show 15 new contracts versus 20 during September 1–19. New listings also fell, from 39 to 17, and available inventory was lower: 125 versus 138. Closings, however, increased from 19 to 22.
That is a mixed early reading: fewer new buyer commitments, fewer fresh listings, and more previously agreed sales reaching the finish line. With both supply and contract activity easing, it is too soon to call a broad shift in bargaining power from October alone.
Source: TrendGraphix “Today’s Stats,” October 1–19 versus September 1–19, 2026. These are matched partial-month windows, not final October totals.
What to do with this information
Selling? Build your plan around today’s competing homes, schedule an early review of market response, and discuss the effect of possible credits on your net proceeds. Buying? Compare available alternatives and ask where price, terms, or closing-cost help might be negotiable.
For brokers, the next useful check is whether new contracts recover as fresh listings slow—and whether concessions are appearing in the closest comparable transactions. Those details will tell us more about the next pricing decision than an area-wide average alone.
Talk with a local Windermere Whidbey expert
Questions buyers and sellers are asking
Is the South Whidbey market slowing down?
September showed a softer pace than August: new contracts fell from 41 to 30, average days on market rose from 35 to 47, and the reported sale-to-list-price ratio fell from 99% to 97%. Homes continued to sell, and the signals differed by price range. These figures support easing seller leverage, not a prediction that every property will lose value.
Which price ranges have sold recently?
In the last 30 days, as of October 20, 2026, South Whidbey recorded 35 closings: eight below $600,000, ten from $600,000 to under $800,000, three from $800,000 to under $1 million, fourteen from $1 million to under $2 million, and none at $2 million or above. These sales cover a different period from the September calendar-month totals.
Should a seller reduce the price after two weeks?
Two weeks is a useful review point, not an automatic deadline for a price reduction. Review showing activity, buyer feedback, and competing listings with your broker. Our office reports reductions around that point for some listings, but each pricing decision should reflect the home and its competition.
Should sellers expect to help with buyer closing costs?
Sellers should prepare for the possibility. Our office reports that requests for seller-paid closing costs are becoming more common, although we do not have a measured rate for those requests. Evaluate the proposed credit alongside the offer price, other terms, and expected net proceeds.